
New facts about changes in Kansas school funding: up, down or flat?
As the 2014 election campaign heats up and school boards adopt budgets for the current year, KASB has been receiving more and more questions about what has really happened to Kansas school funding in recent years.
Questions about school funding will continue to grow because the Kansas Supreme Court has held the test of constitutionally adequate funding is the so-called “Rose” standards for preparing students to be successful in their lives beyond high school. Before the state can decide how much money is needed to reach those standards, there must be an agreement on what we are already spending.
To help answer this question, we started with two documents the Kansas Budget Division - which is headed by Governor Brownback’s budget director - recently posted on its website. First is the budget Comparison Report. This document reflects final Legislative action on the state budget for the the fiscal year that ended June 30 and the current fiscal year that began July 1. Page 60 contains a chart showing state aid programs for K-12 education, including federal stimulus funding during the recession years, from Fiscal Year 2010 to the current year FY 2015 (2014-15 school year). Page 62 contains a chart showing state and federal funding for FY 2013 through FY 2015. The second document is a spreadsheet entitled State and Federal Support of Elementary and Secondary Education in Kansas, which covers the years from 2009 to 2015.
There are two major differences between these reports. The Comparison Report shows the shift of the 20 mill statewide levy from local revenue to state aid, which indicates that state aid increased 23 percent from last year to this year. The second document does not (as of August 3) show that change, which indicates total state and federal support increased just 4.6 percent this year. The second document also includes funding for Governor Brownback’s initiatives that impact K-12 students and districts but are not under the Kansas State Department of Education or included in district budgets: secondary technical education tuition funding through the Board of Regents and funding for the Read to Succeed program, Reading Roadmap and Jobs for America’s Graduates under the Department of Children and Families.
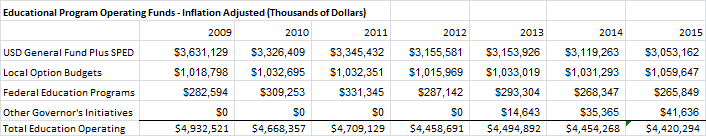
Missing from both of the documents is local school district funding. To show total changes in total school funding, KASB used total school district expenditure levels as provided by KSDE for 2009 through 2013, and KASB estimates for 2014 (final actual spending is not yet reported) and 2015 (budgets are not yet adopted) to develop the following data. (NOTE: All numbers in these tables and charts are in thousands of dollars.)
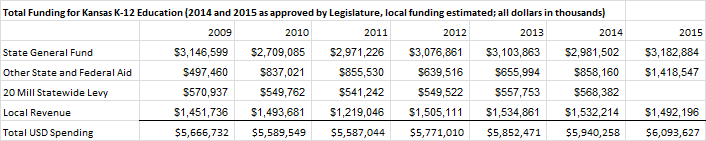
Several items stand out. First, total school district support declined from 2009 to 2011 during the Great Recession. Second, total funding has risen each year from 2011 to 2015. Third, funding from the state general fund - the state’s general purpose “checkbook” of revenue from income and sales taxes - has remained essentially unchanged for five years even though the state economy has recovered, largely because state income tax cuts have reduced available revenue. Fourth, other state funding and federal funding increased from less than $500 million in 2009 to $850 million in 2014, largely because of federal stimulus funding in 2010 and 2011, and the use of state highway funding and expanded lottery revenues for education programs in 2014.
Because the statewide 20 mill levy will be collected by the state, rather than local districts, beginning in 2015, it produces a major increase in “other state and federal funding.” However, this change does not provide an increase in total school funding, because the 20 mill revenue disappears as a local revenue source. Finally, other local revenues are expected to decrease by about $20 million in 2015 because fully funding local option budget state aid will reduce LOB property tax requirements in many districts. These changes are displayed graphically below.
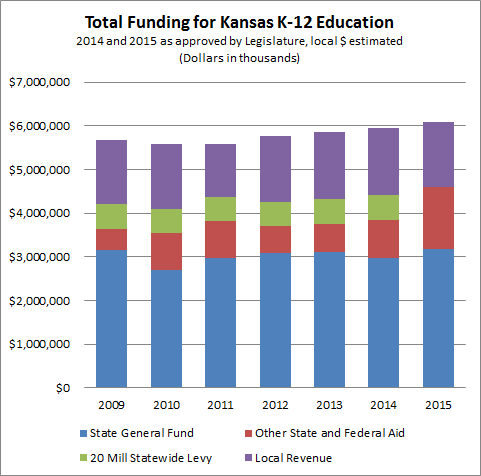
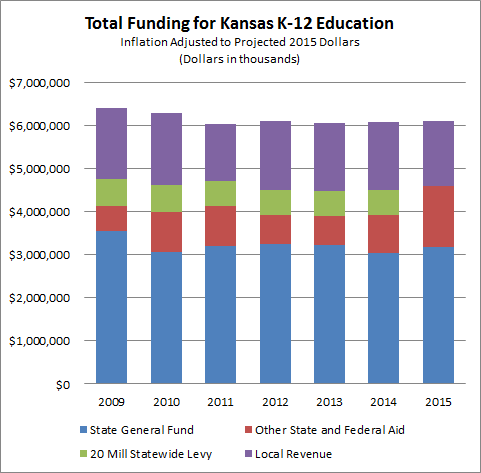
This data shows that school funding has increased every year during Governor Brownback’s administration. However, when adjusted for inflation, the picture looks somewhat different. KASB used the state’s April Consensus Revenue Estimate predictions for changes in the consumer price index in 2014 and 2015, and then adjusted previous years’ funding to projected 2015 dollars.
As the following chart shows, when adjusted for inflation, total K-12 revenue has been essentially flat for the past five years, and is still below 2009 and 2010 levels.
Total revenues by source, however, does not explain how funding has changed for different programs within district budgets. In fact, most of the increase in school funding has not been available for “this year” expenditures for teachers, administrators, and support staff positions or salaries, or other annual operating costs. Instead, most of the increase has gone to pension and building costs.
Most funding for operating costs is in four areas that make up about 75 percent of total school budgets. First is the school district general fund, determined by the base state aid per pupil multiplied by student enrollment as adjusted with pupil weightings, plus special education state aid. Except for a few minor local revenues, this is funded entirely by state aid and the 20 mill statewide levy.
Second is the local option budget, funded by local property taxes, and in about 80 percent of districts, by state LOB aid based on the district’s per pupil property wealth. Third is funding for federal educational programs like special education and Title I (No Child Left Behind), but excluding student meal support and federal stimulus funding that was included in the general fund and LOB funding. Fourth, we included funding for Governor Brownback’s technical education and reading initiatives.
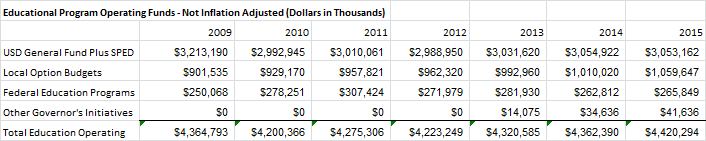
In actual dollars, school district general funds and special education aid have been reduced by about $160 million, but local option budgets have increased by about the same amount. Federal education programs increased about $15 million, and funding for the Governor’s targeted programs increased by about $40 million. As a result, net funding for these programs, after dropping over $200 million in 2010, in 2014 recovered to about the same level as it was six years ago.
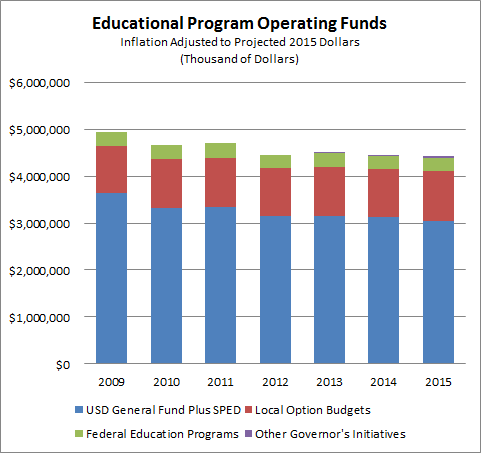
When adjusted for inflation, however, as the following table and graph show, the state’s base support for K-12 education through school district general fund budgets has declined almost $500 million, and Local Option Budgets did no more than keep up with inflation until 2015, when the Legislature increased the maximum LOB districts can adopt. Federal education program funding declined $15 million during this timeframe.
These figures illustrate why school leaders continue to express deep concerns about the adequacy of school funding, despite increases that have been provided in certain areas. When measured against changes in the cost of living, funding for educational programs that can actually be spent on teachers, administrators and student support programs has declined by $500 million since 2009, and even the increases in these areas provided by the 2014 Legislature for 2015 will be less than the projected rate of inflation.
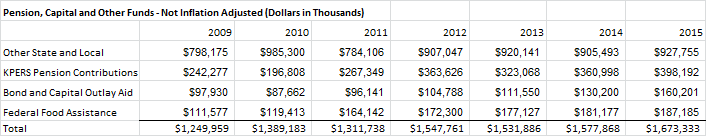
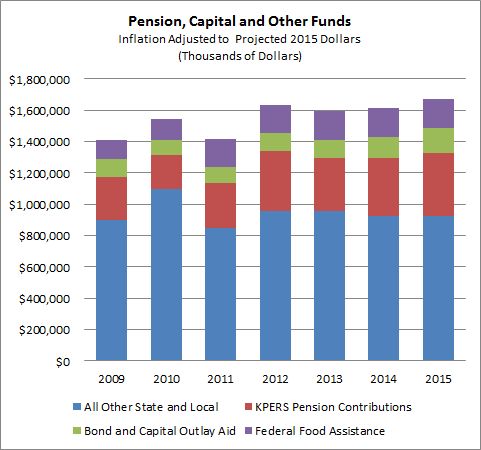
The remaining one-quarter of total school funding looks much different. This includes KPERS pension contributions made by the state for local school employees, which pass through school budgets but cannot be used for regular operating costs or current salaries. In response to significant underfunding in the state retirement system, the state increased this funding by over $150 million in the past six years. Second, state aid for bond payments and capital outlay for low property wealth districts increased by over $60 million. Third, federal food assistance to support free- and reduced-price meals for low income students increased by over $70 million.
The final and largest area is “all other” state and local funding, primarily school district payments for capital costs and debt service: building, remodeling, equipment and bond payments, which increased $230 million. (This area also includes the costs of “paid” student meals.)
These increases are reduced when adjusted for inflation, as the following table and chart shows:
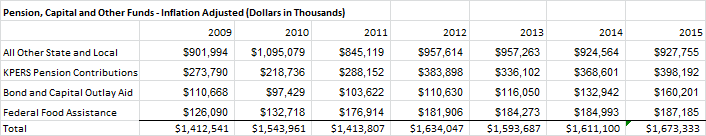
This data hopefully clarifies some of the competing claims about school funding. Total school funding has been increasing in real terms, but has essentially been flat when adjusted for inflation. Within total budgets, support for current educational costs - salaries for teachers, administrators and student support positions and other student services - has been declining, while funding for student meals and long-term costs for buildings and retirement pensions has been increasing.
School districts have very little control over these budget trends. The district general fund (base per pupil and weightings), special education aid, KPERS funding and all federal funds are determined at the state and federal level. The state caps the amount of LOB and capital outlay funds that can be raised. Just about the only part of the budget entirely controlled at the local level are construction bonds, which must be approved by local voters.
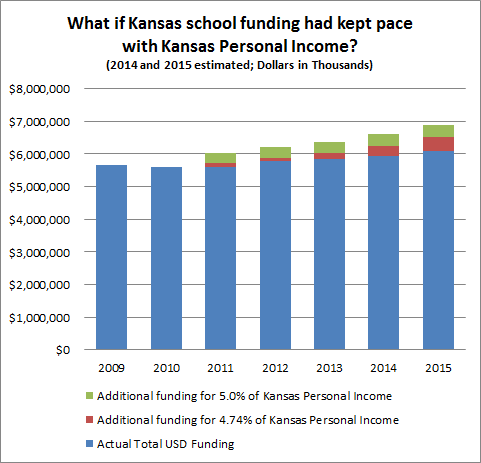
A final comparison is to see what might have happened if school funding had followed the state economic recovery. Since 1990, total school funding in Kansas has averaged about 4.74 percent of total personal income in the state, which is the annual income of all Kansas residents. In 2009 and 2010, it was over 5 percent, as a result of additional funding provided after the Kansas Supreme Court Montoy school finance decision found that the state was not providing constitutionally suitable finance, and a drop in personal income during the Great Recession.
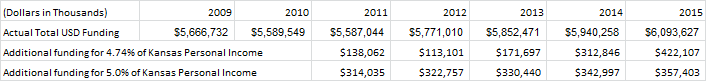
However, as the state began to recover from the recession, school funding has fallen behind growth in personal income. Based on the Consensus Revenue Estimate projection for personal income growth in 2014 and 2015, KASB estimates total personal income will have increased 25 percent from 2009 to 2015, but K-12 funding will have increased less than 8 percent. Total funding would be $422 million more next year if equal to the historical average percent of total Kansas personal income (4.74 percent), and over $750 million more if the level reached after the Montoy settlement had been maintained (5 percent).
If even the lower revenue level was available, the Legislature could have come close to funding the base budget per pupil at the previously approved level of $4,492, at a cost of $440 million. At the higher level, the state could also have funded all day kindergarten for all students, expanded preschool programs and provided other educational enhancements to help meet the new Rose standards for successful students.