Wednesday, May 10, 2017

Evidence shows Kansas schools are organized and operated efficiently to produce high student outcomes.

This post is from a report on school finance released by KASB as the Kansas Legislature works to develop a new school finance plan in compliance with the Kansas Supreme Court decision on adequate funding. Today: contrary to claims that Kansas schools are administratively top-heavy, Kansas compares well to the highest achieving states in the nation.


Rather than increase funding, some policy-makers and advocates suggest that districts could cut administrative overhead and redirect funding to achieve better results. Evidence indicates that Kansas is already following best practices for staffing and organization.


A. Kansas school district spending on superintendent salaries and “back office” costs are minimal.


Total Kansas superintendent salaries were $31 million last year, or 0.5 percent of total expenditures. Expenditures for all central office and districts administration function – including “back office” functions like payroll, human resources, etc. – are $266 million, or 4.4 percent of expenditures. Even a significant reduction in those areas would not result in major changes in other areas.


B. High achieving states have more teachers, more support staff, more administration, smaller schools and smaller districts. Low achieving states are the opposite.


Federal data from the Digest of Education Statistics indicate that not only do the highest achieving states spend more pupil, they have many more employees per 1,000 students, including administrative staff.


The highest achieving states have 160.7 staff positions per 1,000 student, and 6.3 are in district administration. Kansas has 143 staff per 1,000 students, but just 3.8 are in district administration – less than the national average.


The highest achieving states have more teaching positions than Kansas, but Kansas provides about the same percentage of these positions, and has more instructional positions than the national average or the lowest achieving states. Kansas also has more principals and student/teacher support positions (such as librarians, counselors, nurses, etc.) than the national average and lowest achieving states.
In addition, national data shows that the highest achieving states have smaller school district size and smaller average school size than the national average and lowest achieving states.

KASB research on Kansas assessments confirms national studies that smaller school size has a positive correlation with student outcomes.

Tuesday, May 9, 2017

Specific ways school districts will use additional funding to improve student success.

This post is from a report on school finance released by KASB as the Kansas Legislature works to develop a new school finance plan in compliance with the Kansas Supreme Court decision on adequate funding. Today: how increased funding would be used to improve student success.


Although each district’s needs and circumstances will be different, the general uses of new funding is clear, based on conversations KASB held with school leaders this year and how districts used additional resources after Montoy decision. Targets for new funding would likely include:

Add/restore positions to keep low class size and improve services

Restore certified (mostly teacher) positions reduced since 2009;
1,000 times average teacher salary of $55,454 $55.6 million

Restore non-certified positions (aide, para, etc.) reduced since 2009;
1,000 FTE positions times estimated salary of $35,000 $35.0 million

Expand preschool to meet State Board goal of kindergarten readiness

Double pre-K teachers to double preschool enrollment;
580 positions times average teacher salary of $55,454 $32.2 million

Increase services to meet career planning and social/emotional needs
Increase school counselor and social worker positions (currently
approximately 1,500) by 50 percent; 750 positions times average
teacher salary of $55,454 $41.6 million

Add services for students not meeting standards

Provide intensive services to students below grade level in reading or math
(such as Reading Roadmap) at average cost of $1,000 per student
to all students below grade level (25% x 462,595 = 115,649) $115.7 million

Provide intensive services to students below college ready at average cost
of $1,000 per student (38% x 462,595 = $175.8) $175.8 million

Provide Jobs for America’s Graduates services (or similar) at average
cost of $1,230 for 40 percent of students grades 9-12 based on risk
factors (56,000) $68.8 million

Restore salary levels to keep Kansas school positions competitive

Inflationary adjustment for teacher salaries 2009 to 2016
Average teacher salary in 2009: $52,712 times inflation increase
of 11.9% Equals $58,985 minus 2016 actual of $55,454 ($3,531)
x 35,882 teachers $127 million

Comparable increase for all other district staff members $127 million

Total funding increase: $778.7 million

Other benefits of increased funding:

With higher salaries, increase school year for students, which has been reduced by approximately one week as districts negotiated fewer days under limited salary increases.

Reduce student fees, which have increased significantly in some districts for activities, early childhood and transportation.

Reduce property tax reliance, which has increased as districts used more local option budget funding with frozen base state aid.

Monday, May 8, 2017

The school finance plan developed by the House K-12 committee plan is sound; the amount of funding is justified but will be eroded the longer it is spread out

This post is from a report on school finance released by KASB as the Kansas Legislature works to develop a new school finance plan in compliance with the Kansas Supreme Court decision on adequate funding. Today: how the plan developed by the House K-12 Committee measures up in structure, and evidence to support the amount of new funding.


The structure of the House K-12 Committee plan is constitutionally sound, supported by evidence and addresses public concerns.


After two years of research, statewide input from school leaders and collaboration with other organizations, KASB adopted a set of school finance recommendations called Putting Students First. The proposed House committee plan meets most of those goals.


A. The plan includes three key component of school finance: per pupil funding, adjustments for different costs and equalized local flexibility.


It would return Kansas to a modified foundation formula used by all nine higher achieving states; and sets a higher foundational amount per student, although phased in over five years.
It restores weighting factors previously acceptable to Kansas Supreme Court, based on previous cost studies.


It authorizes local options for funding operating and building costs equalized at levels previously found acceptable by the court. The increases in base state aid will allow increased use of the proposed Local Foundation Budget.


B. The plan directs significant additional funding to lower performing students and to help more students reach higher levels.


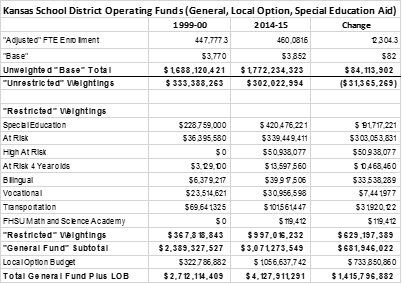
Approximately 30 percent weighted enrollment under the plan would be for bilingual, at-risk and vocational weightings, so 30 percent “foundation” increases would go to those programs. In addition, the bill would expand funding for at-risk preschool by $2 million per year for five years.


The bill would fund students in all day kindergarten programs as full-time students, which many districts currently fund through at-risk weighting; which would allow funding to be directed at additional at-risk programs.


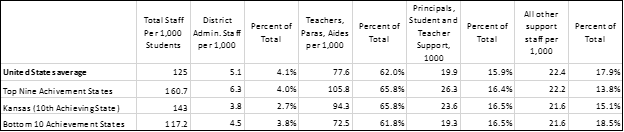
Foundation funding increases would allow schools to provide low class size, which is critical for helping at-risk students; restore or add teachers in high need area; and provide compensation to attract and retain quality staff, after Kansas teacher salaries have lagged behind inflation and declined in national ranking since 2008.


The plan would restore funding for two critical programs to improve instruction and promote innovative practices: teacher professional development and new teacher mentoring.


C. The plan bases accountability on meaningful measures of student success.


The bill provides accountability through the new accreditation system being implemented by the State Board of Education under the Kansans Can initiative. The effort is based on two years of public hearings, employer and higher education input and development by education leaders.
The new system has five outcomes: kindergarten readiness, individual career-based plans of study, social and emotional factors measured locally, higher graduation rates and higher postsecondary participation. The system will track student participation in technology and academic programs for two years after high school.


The amount of funding in the plan is justified by evidence, but this would be eroded the longer it takes to be fully implemented.


The Kansas Supreme Court did not order a specific total amount of funding; however, there are a number of indicators to suggest a range of funding levels required to provide “suitable” finance for educational improvement and student success.


A. Inflation since the funding was found constitutional under the Montoy decision and Legislative remedy.


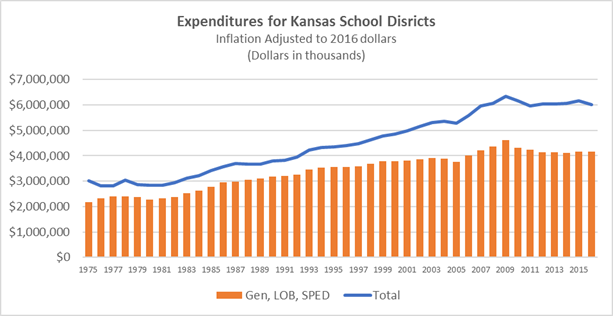
The Kansas Supreme Court approved a three-year plan to provide suitable funding by 2009. Total school district funding in 2016 was about $525 million below 2009 levels when adjusted for inflation, and general operating funds (general fund, local option budget and special education aid) are over $600 million below. The House Committee plan provides a total of over $750 million, but would not be fully implemented for five years.


B. Previous rates of Kansas funding associated with educational improvement.


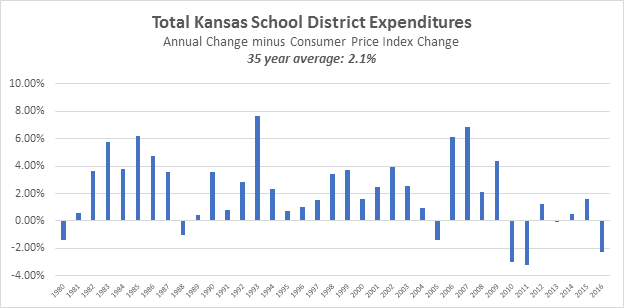
Rate of growth. Since 1990, school funding increased an average of approximately two percent more than inflation, over which time Kansas educational outcomes improved significantly. It would require an additional $162 million in general fund, LOB and special education to provide this rate of increase over the next two years. The House Committee plan would provide annual increases of approximately $150 million in general funding and special education aid per year for five years, plus additional authority for the local option budget as the foundation level increases.


Percentage of personal income. From 1975 to 2010, total school district funding in Kansas averaged 4.54 percent of state personal income. Based on the Kansas Consensus Revenue Estimate of state income growth, Kansas personal income will be $146.6 billion in 2017 and $152.3 billion in 2018. Providing total K-12 funding of 4.45 percent would equal $6.61 billion for 2017 and $6.914 for 2018, compared to $6.021 in 2016; or an increase of $590 million for 2017 and a further $300 million for 2018 – a two-year total of about $900 million. The House Committee plan would provide $750 million over five years.


C. States that have higher levels of overall student success.


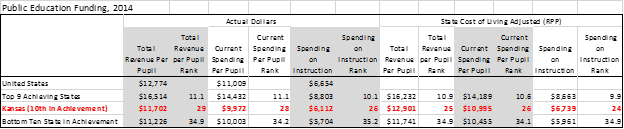
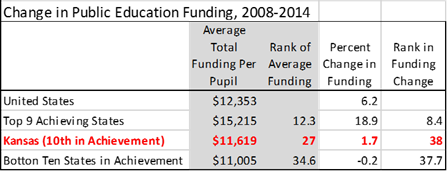
After adjusting for regional cost differences, states that perform better than Kansas on 15 educational measures spent $2,855 more per pupil than Kansas in 2014, equal to over $1.3 billion more. The Midwestern states that outrank Kansas spend $1,407 more per pupil than Kansas, equal to $650.9 million more than Kansas. If Kansas funding had increased at the same rate as higher achieving states since 2008, total funding would be $1,385, or $640.7 million, higher.


D. Recommendations of the State Board of Education.

The State Board of Education, which seeks to implement the Kansans Can vision of preparing each student for success consistent with the Rose Capacities, has proposed a total increase of $893.5 million. Most of this money would increase the previous base state aid per pupil. It would also fund special education aid at the statutory level, and fund teacher mentoring and professional development.

Thursday, May 4, 2017

Evidence demonstrates that school funding is critical to student success.

This post is from a report on school finance released by KASB as the Kansas Legislature works to develop a new school finance plan in compliance with the Kansas Supreme Court decision on adequate funding. Today: how past Kansas funding has supported educational improvement, how states that outperform Kansas fund their public schools; and what past Kansas studies have said about funding and student success.


The Kansas supreme Court agreed that money is related to educational performance. Multiple reasons support this.


A. Until recently, Kansas educational improvement was supported by increasing funding more than inflation and targeting more funding at special needs students.


A previous post discussed the steady increase in educational attainment in Kansas. That rise in education levels has been matched by funding increases that have consistently exceeded inflation. However, since 2009, total funding has fallen behind inflation.


As part of higher overall funding, much more funding has been added to address special student needs. Between 2000 and 2015, total state funding for general operating funds, special education state aid and local option budgets increased about $1.4 billion. Over 44 percent of that increase was for “restricted” purposes such as special education or  at-risk services (including expansion of all day kindergarten programs, bilingual services and transportation).


In addition, federal funding for targeted programs such as special education and Title I programs for disadvantaged students increased from $130 million to $325 million, and federal aid for student meal programs doubled from $90 million to $180 million between 2000 and 2015.


Together, these programs helped school districts graduate more students and prepare more students for postsecondary education and careers. Kansas has boosted graduation rates and prepared more students for college by assisting students that previously did not reach those levels.


B. States with higher overall student achievement than Kansas in areas related to the “Rose” capacities provide more total funding.


Last August, KASB ranked all states on a weighted average of 15 indicators closely aligned to the Legislature’s state education goals and the State Board’s Kansans Can outcomes.
The indicators are: percent of young adults completing high school, some college or a four-year degree by age 24; graduation rates for all students, low income, disabled, English Language Learners, percent of all students, low income and non-low income students at both the basic and proficient levels of the National Assessment of Education Progress, and performance on the ACT and SAT tests, adjusted for percent of students participating.


Here are more details the research found:


The nine states with higher overall average achievement (New Hampshire, Massachusetts, New Jersey, Iowa, Nebraska, Vermont, Illinois, North Dakota and Connecticut) provided about $4,800 more per pupil than Kansas, and about $3,000 if adjusted for cost of living differences. (2014 data).


The 10 lowest performing states (Alabama, Oregon, Florida, Mississippi, Georgia, Arizona, Louisiana, New Mexico, Alaska and Nevada) provided an average of $500 less per pupil than Kansas, and over $1,000 less if adjusted for cost of living.
Although Kansas remains a high achieving state, on most of the 15 educational measures used, the national average improved more than Kansas. In other words, Kansas has been lagging in both funding and educational improvement.


C. Past Kansas studies have shown the importance of funding levels and targeted funding.


Following the Montoy decision by the Kansas Supreme Court, the Legislature commissioned the Legislative Post Audit Division to conduct a comprehensive study of the cost of K-12 in terms of both required inputs and desired outcomes. The results included three major findings.


First, the study found a nearly one-to-one correlation between increased funding and student outcomes measured by standardized tests.


Second, the study developed the basis for the major weightings set by the Legislature and approved by the Kansas Supreme Court under the previous school finance system, and which are recommended by the House K-12 Budget Committee in HB 2410.


Third, adjusted for inflation, the base or foundational amount found to be required to meet standards in 2006 would be significantly higher today.

Wednesday, May 3, 2017

Kansas’ educational attainment is at an all-time high, but it must continue to improve.

This post is from a report on school finance released by KASB as the Kansas Legislature works to develop a new school finance plan in compliance with the Kansas Supreme Court decision on adequate funding. Today: what the Kansas Constitution says about educational improvement and funding, how educational outcomes have improved, and why more is required.

A. The Kansas constitution mandates a system of public schools for educational improvement, and the state is responsible for the finance of that system.

Article Six of the Kansas Constitution, amended by the people in 1966, states in Section 1: “The legislature shall provide for intellectual, educational, vocational and scientific improvement by establishing and maintaining public schools, educational institutions and related activities which may be organized and changed in such manner as may be provided by law.” Section 6 directs that “The legislature shall make suitable provision for finance of the educational interests of the state.”

B. Overall Kansas educational attainment has been steadily improving for decades.

Long term education trends. The U.S. Census Bureau has tracked completion of high school and a four-year college degree by state since 1940. Kansas has improved educational attainment each decade, and further improved in the five years since the 2010 census.


Details for adults 25 and older since 1990. Kansas has decreased the percent of the population not completing high school by half (from 19.7 to 9.7 percent. The percentage of high school graduates with any college experience, including a technical certificate or associated degree, increased from 27.3 to 32.0 percent. The percent with a four-year degree increased from 14.4 to 20.4 percent, and with an advanced degree increased from 7.0 to 11.4 percent.

Details for Kansans age 18-24 since 2000. For the age group most recently in elementary and secondary schools, the percentage of young adults who have not completed high school declined from 21.7 to 12.5 percent. The percentage completing high school increased from 78.3 to 87.5 percent.  The percentage with any college less than a four year degree increased from 43.9 to 48.9 percent, and completing a four-year degree has increased 7.6 to 8.9 percent. (The most recent data is from 2015, so 18-24-year-olds includes students in classes graduating from about 2009 through 2015.)

C. Despite improved educational levels, more Kansans will need higher levels of education to meet workforce demands and provide individual economic security.

The Georgetown Center for Education and the Workforce has estimated that about 99 percent of jobs created since the Great Recession require more than a high school diploma. Kansas is expected to be in the top ten states in the percentage of jobs that will require a postsecondary credential. These are the higher paying jobs with benefits that allow a chance for middle-class life. These are the goals of the State Board of Education’s Kansans Can vision and outcomes, based on input from thousands of Kansans in community and business leader meetings.

If Kansas is going to thrive, it will take more than tax policy alone. It will take a workforce with the educational skills to fill and succeed in the kinds of jobs being created. Fortunately, Kansas is well poised to succeed. Among adults age 25 and older, Kansas ranks 17th in high school completion, 15th in some postsecondary completion, including technical certificates and two-year degrees, and 17th in completion of four year degrees or higher. However, to add jobs and raise income levels, Kansas will continue to improve education levels. The evidence says that will require continuing to raise education funding.

After decades of increasing funding to support educational improvement, Kansas policy has changed. So has performance

This post is from a report on school finance released by KASB as the Kansas Legislature works to develop a new school finance plan in compliance with the Kansas Supreme Court decision on adequate funding. Today: since 2009, school funding in Kansas has not kept up with inflation; improvement in some educational indicators has reversed, especially for some groups; and these groups are not evenly distributed across the state.


For nearly 35 years, Kansas consistently increased school funding more than inflation, which funded improvement resulting in higher educational levels. Since 2009, that has reversed.


A. Overall Kansas school funding has fallen behind inflation since 2009, and state and local operating funding has fallen even further behind.


Although overall dollars are higher, when adjusted for inflation, total Kansas school funding is lower than 2009 and at the same level as 2007, and general operating budgets (general funding, local option budgets and special education state aid) is at 2006 levels – meaning no “real” (above inflation) increase in approximately ten years.


This ten-year effective funding freeze has occurred when enrollments have increased, especially for special needs students, and expectations for student achievement have risen.


B. Kansas funding has fallen behind other states, especially the highest achieving states.


Between 2008 and 2014, Kansas per pupil funding increased just 1.7 percent, less than one third of the national average of 6.2 percent. Thirty-seven states increased per funding more than Kansas.


Over that period, the highest achieving states increased per pupil funding by 18.9 percent, while the lowest achieving 10 states cut funding by 0.3 percent.


C. State and national tests of basic skills, which are “early indicators” of student success, show signs of decline or stagnation, especially for students with special needs.


The State of Kansas argued in the Gannon case that the high and rising level of educational attainment in Kansas was evidence of funding as constitutionally suitable and adequate. The Supreme Court rejected that view for three reasons.


1. Recent educational indicators suggest that educational improvement is slowing and perhaps reversing.


The Supreme Court relied heavily on two types of assessments: state tests given to almost all Kansas students, but which were significantly changed in between 2013 and 2015, and the National Assessments of Educational Progress, which is given to small sample of students in Kansas and all other states.


State assessments


On the Kansas assessments since 2007, the percent of students scoring at the “proficient” level under the No Child Left Behind act rose steadily for all students and low income students until 2012.


However, performance levels dropped noticeably  in 2013, the last year of the previous round of assessments. A new testing system was to begin in 2014, but because of technical issues no results were provided. Results for the new test, which used a benchmark called “grade level” comparable to the previous “proficient” began in 2015 and scores further declined in 2016.


National assessments


Kansas, like all other states since 2003, participates in the National Assessment of Educational Progress (NAEP), which tests a sample of students in reading and math at fourth and eighth grade in odd-numbered years. The “basic” level of NEAP is comparable the “grade level” benchmark on the new state assessments.


Beginning in the early 2000’s, Kansas NAEP performance increased through 2007, remained fairly level through 2011, and declined in 2013 and 2015. (Although NAEP allows comparison with other states and provides a longer timeframe than state assessments, which tend to change every few years, it has the limitation of being a much smaller sample size and only two grade levels.)


National Assessment of Education Progress: Percent of All KS Students At Basic or Above

2000/02
2003
2005
2007
2009
2011
2013
2015
Fourth Grade Math
76
85
88
89
89
90
89
83
Eighth Grade Math
76
76
77
81
79
80
79
76
Fourth Grade Reading
68
66
66
72
72
71
71
68
Eighth Grade Reading
81
77
78
81
80
79
78
79
Average
75.25
76
77.25
80.75
80
80
79.25
76.5


Other indicators
Although state and national standardized tests have shown a decline in recent years, other indicators are more mixed. As noted above, educational attainment by young adults has continued to improve. The state’s “on time” graduation rate has also improved, and the percentage of students scoring “college ready” in all subjects on the ACT exam for prospective college students has increased.  The concern is that declining performance at lower grades measured by state tests and the NAEP will begin to impact performance of older students as they prepare for graduation and college.


2. Too many Kansas students are not meeting expected educational outcomes, especially among certain groups.


The Supreme Court included the following table in the recent Gannon decision.


The chart shows the percentage of students NOT scoring at the “proficient” or “grade level” benchmarks on state assessments and the percent of students NOT scoring at basic on the NAEP in the overlapping grades and subjects. Note these percentages in the most recent years range from around 17 to 24 percent for ALL students, but are significantly higher for African Americans, Hispanics and English Language Learners.


These “achievement gaps” are consistent with other KASB reports showing that low income students, students with disabilities and other groups have lower graduation rates and NAEP scores.


3. These students are not randomly distributed across schools and districts; they are disproportionately students with circumstances that affect their success in school.


Most students who lag behind their peer and are “at risk” of failing to graduate are affected by circumstances outside of the school’s direct control, such as poverty, disability, illness, family issues, etc. (It is hard to do homework if you are homeless.) These factors are not evenly distributed.