
School districts report cash balances in all funds on July 1 of each year, and on the first of each month for most, but not, all funds. Some funds are highly restricted and can be used only for specific purposes like building costs, bond payments and special programs. Other funds are more flexible because school districts may move money in and out with fewer restrictions. The most flexible funds were designated several years ago by the Legislature in SB 111.
As the chart below shows, about two-thirds of cash balance at the beginning of this year were in restricted funds that cannot be used for general operating costs. Over half of balances for capital outlay, which includes savings for long-term costs; bond payments; and other purposes supported by local mill levies. Other restricted funds include areas such as insurance reserves and gifts and grants.
Another 14 percent of balance on July 1 are for programs that need operating funds for summer school, or for areas that do not received revenues until later in the school year, such as special education and food services. That leaves just 20 percent of cash on hand for general operating purposes.

This report shows that school district flexible funds have remained stable as a percentage of school district general fund budgets, local option budgets and special education aid. These components of school district budgets are similar to the general state fund. Furthermore, school balances in these areas are actually lower than the combined state general fund ending balance plus “certificates of indebtedness,” which is how the state provides for cash flow.
A broader definition of “non-restricted” operating funds shows that statewide school district July 1 balances have been at the low end of the range the Governmental Finance Officers Association says is appropriate for “moderate to high” risk.
Finally, school districts balances vary significantly by month because of district cash flow needs, which is why a single date to measure balances, such as July 1, is not appropriate.
July 1 balances as percent of total expenditures
As the chart below shows, total cash balances on July 1 as a percent of total district expenditures have been increasing in recent years. However, most of this increase has been in more restricted funds. SB 111 funds have remained fairly stable since 2011.


The next chart compares school district balances or reserves to the recommendations from the Governmental Finance Officers Association, quoted in the 2016 Alvarez and Marsal efficiency study commissioned by the Kansas Legislature. The A&M study said the GFOA recommends balances of 10 percent or less in low risk financial conditions; 10-15 percent for low to moderate risk; 15-25 percent for moderate to high risk, and 25 percent or higher for high risk conditions.
For this chart, KASB used a broader group of funds than the SB 111 funds. It compares the total balances of all “unrestricted” funds to school district general funds, local option budget and special education state aid.
School districts raised balances sharply after 2008 when Kansas entered the most difficult economic and budget circumstances since the 1930s; reduced the percentage as conditions improved after 2012; and have increased balances modestly during the last two years amid uncertainty over school finance and the possibility of a court-ordered action that could close schools.

The next chart compares SB 111 funds (both the contingency reserve fund and all other SB 111 funds) as a percentage of school district general funds and local options budgets. SB 111 funds are basically used as reserve or contingency funds for general operating budgets and for cash flow. These funds have remained very stable at approximately 10 percent of budget since 2011.

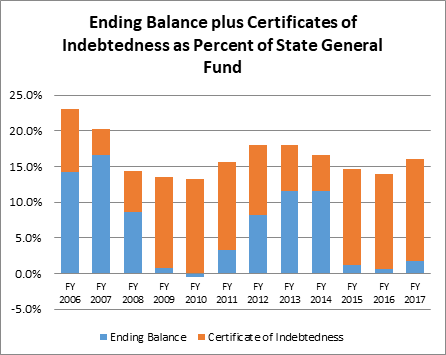
School district balances may be compared to the state general fund in the next chart, which shows the SGF ending balance plus the amount of certificates of indebtedness annually. The certificates are basically the state borrowing from other funds for contingency and cash flow. This level has been approximately 15 percent since 2008, which is similar to the percentage of all unrestricted funds compared to school districts general operating budgets and higher than the percentage of SB 111 funds.

Monthly cash balances
The 2015 Legislature passed a requirement that school districts make monthly reports of cash balances in certain funds throughout the year. As the following chart shows, any single month, including the July 1 report, shows only part of the story. Like the state general fund, school district revenues and expenditures vary by month. In fact, many revenues such as property tax payments are received at selected times throughout the year, while districts have relatively steady operating costs.
For example, the orange line below shows large increases in certain times of the year because school districts receive state aid payment or local property tax distributions, but then spend down those balances. The orange line also is unusually low in July because these reports do NOT include delayed state aid payments, which are not recorded until the August report. On the other hand, SB 111 funds are at their high point in July, and steadily decline during the year. Districts usually transfer money into the funds in June to provide enough operating funds to begin the next year.

For example, districts always begin the year in July with the highest balance in the special education fund – over $170 million statewide each of the past three years. However, by May that number has dropped to about $50 million. If districts did not have large enough balances to begin the year, they would run out of money before state and federal aid payments are made during the year. The $50 million “low point” represents less than 10 percent of combined federal and state special education aid.
Like the state using certificates of indebtedness to borrow from other funds during the year, school districts must manage all funds for cash flow, savings for future projects and contingencies such as unexpected expenses and reductions or delays in revenues.
KASB groups school districts funds as follows:
Group 1 - Constitutionally Restricted Funds (raised by Local Mill Levies), which can be only spent for those purposes. Primarily these are for capital costs. Although some districts receive state aid, these funds can only be spent for the same purpose.
Group 2 - Other Effectively Restricted Funds, which are not limited by tax levies but can only be spent on restricted purposes such as federal funds, gifts and grants (which are rarely for general operating expenditures) special reserves for school district insurance programs, and student materials which cover the cost of textbooks and other specific items.
Group 3 - Funds to Cover Expenses until Revenues are Received; Funds with Summer Expenses. This group is also restricted to specific purposes, and districts must have money in these programs at the beginning of the fiscal year to cover costs until state aid or other revenues are paid later in the year.
Group 4 - General Education Operating Funds are those funds associated with general school district operations.
For this chart, KASB used a broader group of funds than the SB 111 funds. It compares the total balances of all “unrestricted” funds to school district general funds, local option budget and special education state aid.
School districts raised balances sharply after 2008 when Kansas entered the most difficult economic and budget circumstances since the 1930s; reduced the percentage as conditions improved after 2012; and have increased balances modestly during the last two years amid uncertainty over school finance and the possibility of a court-ordered action that could close schools.


Monthly cash balances
The 2015 Legislature passed a requirement that school districts make monthly reports of cash balances in certain funds throughout the year. As the following chart shows, any single month, including the July 1 report, shows only part of the story. Like the state general fund, school district revenues and expenditures vary by month. In fact, many revenues such as property tax payments are received at selected times throughout the year, while districts have relatively steady operating costs.
For example, the orange line below shows large increases in certain times of the year because school districts receive state aid payment or local property tax distributions, but then spend down those balances. The orange line also is unusually low in July because these reports do NOT include delayed state aid payments, which are not recorded until the August report. On the other hand, SB 111 funds are at their high point in July, and steadily decline during the year. Districts usually transfer money into the funds in June to provide enough operating funds to begin the next year.

For example, districts always begin the year in July with the highest balance in the special education fund – over $170 million statewide each of the past three years. However, by May that number has dropped to about $50 million. If districts did not have large enough balances to begin the year, they would run out of money before state and federal aid payments are made during the year. The $50 million “low point” represents less than 10 percent of combined federal and state special education aid.
Like the state using certificates of indebtedness to borrow from other funds during the year, school districts must manage all funds for cash flow, savings for future projects and contingencies such as unexpected expenses and reductions or delays in revenues.
Cash Balances in Fund Groups
KASB groups school districts funds as follows:
Group 1 - Constitutionally Restricted Funds (raised by Local Mill Levies), which can be only spent for those purposes. Primarily these are for capital costs. Although some districts receive state aid, these funds can only be spent for the same purpose.
Group 2 - Other Effectively Restricted Funds, which are not limited by tax levies but can only be spent on restricted purposes such as federal funds, gifts and grants (which are rarely for general operating expenditures) special reserves for school district insurance programs, and student materials which cover the cost of textbooks and other specific items.
Group 3 - Funds to Cover Expenses until Revenues are Received; Funds with Summer Expenses. This group is also restricted to specific purposes, and districts must have money in these programs at the beginning of the fiscal year to cover costs until state aid or other revenues are paid later in the year.
Group 4 - General Education Operating Funds are those funds associated with general school district operations.
Finally, in yellow shading, are funds designated as “flexible funds” in SB 111 passed several years ago, in which the Legislature gave school districts more authority to use reserves for other purposes.
A further $60 million increase was in federal funds, special reserves for school district insurance programs, and textbook/student materials funds where money may be accumulated for major textbook or software purposes.
(Contact mtallman@kasb.org for a spreadsheet of all July 1 cash balances in school district funds since 2006.)
(It is important to know that the beginning balance is inflated by the fact that school districts are required to count certain state aid payments as being received in June, even though the actual money is not received until July.)Total cash on hand July 1 increased by $270 million over the past two years, but $155 million was in capital outlay, in which districts may accumulate funds for capital projects without using debt; and in bond and interest funds, which increase when districts must have more local property tax on hand to make bond payments.
A further $60 million increase was in federal funds, special reserves for school district insurance programs, and textbook/student materials funds where money may be accumulated for major textbook or software purposes.
(Contact mtallman@kasb.org for a spreadsheet of all July 1 cash balances in school district funds since 2006.)