Wednesday, August 14, 2013

Celebrating Back To School Success

As 485,000 students return to public school districts across the state, it is a good time to reflect on an important fact: our schools are helping more students achieve at higher levels than ever before in history.

There are three common criticisms of public education: (1) educational outcomes are declining or stagnant at best; (2) public schools are particularly failing to meet the needs of low income and minority students; and (3) taxpayers are “spending more and getting less” from public schools.

In fact, academic achievement and educational attainment has been rising, the achievement gap between whites and minority students has been closing, and school spending as a share of personal income is lower than it was in 1970.

Long Term Reading and Math Scores


The National Assessment of Education Progress released a new long term report card this summer that tracked reading and math performance at ages nine, thirteen and seventeen since the 1970’s. (This study is different from the biennial NAEP test report for reading and math, which report results by individual states at grades four and eight. State NAEP results for 2013 are due to be released this fall.)  The long term report card report found that performance had improved for all students at age nine and thirteen and was essentially unchanged at age 17.

But it also found that performance for each major racial/ethnic group of students – white, black and Hispanic – had improved at all three age levels.  Black and Hispanic students still score lower than whites, but the gap has been narrowed over the past four decades.  The percentage of non-white students more than doubled since the 1970’s.  If not for changes in the racial composition of students tested, performance would be up at all ages.  In other words, there more many more minority students who on average score lower than white students; but the scores of minority students have increased more than majority students. U.S. schools are educating more challenging students to higher levels.


Changes in NAEP reading average scores and score gaps for 9-, 13-, and 17-year-old students, by selected characteristics: various years
CharacteristicsSubgroupsScore changes from 1973Score changes from 2008
Age 9Age 13Age 17Age 9Age 13Age 17
All studentsAll studentsup arrow13up arrow 8arrowarrowup arrow 3arrow
Race/ethnicityWhiteup arrow15up arrow 9up arrow 4arrowarrowarrow
Blackup arrow36up arrow24up arrow30arrowarrowarrow
Hispanicup arrow25up arrow17up arrow21arrowup arrow 7arrow
GenderMaleup arrow17up arrow 9up arrow 4arrowarrowarrow
Femaleup arrow10up arrow 6arrowarrowup arrow 3arrow
Score gapsWhite – BlackNarrowedNarrowedNarrowedarrowarrowarrow
White – HispanicNarrowedNarrowedNarrowedarrowNarrowedarrow
Male – FemaleNarrowedarrowarrowarrowarrowarrow
up arrow Indicates score was higher in 2012
arrow Indicates no significant change in 2012.


Changes in NAEP mathematics average scores and score gaps for 9-, 13-, and 17-year-old students, by selected characteristics: various years
CharacteristicsSubgroupsScore changes from 1973Score changes from 2008
Age 9Age 13Age 17Age 9Age 13Age 17
All studentsAll studentsup arrow25up arrow19arrowarrowup arrow 4arrow
Race/ethnicityWhiteup arrow27up arrow19up arrow 4arrowarrowarrow
Blackup arrow36up arrow36up arrow18arrowarrowarrow
Hispanicup arrow32up arrow32up arrow17arrowarrowarrow
GenderMaleup arrow26up arrow21arrowarrowarrowarrow
Femaleup arrow24up arrow17up arrow 3arrowup arrow 5arrow
Score gapsWhite – BlackNarrowedNarrowedNarrowedarrowarrowarrow
White – HispanicarrowNarrowedNarrowedarrowarrowarrow
Male – FemalearrowarrowNarrowedarrowarrowarrow
up arrow Indicates score was higher in 2012
arrow Indicates no significant change in 2012.

Graduation Rates


The 2013 edition of  "Diplomas Count," an annual study of high school graduates, found U.S. graduation rates have reached a forty-year high, with strong growth over the past decade. “Much of the nation’s improvement since 2000 has been driven by strong gains for historically underserved groups," the report reads. “Graduation rates for Latino students have skyrocketed 16 percentage points over this period, reaching 68 percent for the class of 2010. Rates for black students, now at 62 percent, have risen 13 points.”

These findings are supported by the National Center for Education Statistics in the report  Trends in High School Dropout and Completion Rates in the United States: 1972-2009This report used a different calculation, but also found improving high school graduation rates since 1972 for all students. This report shows the “achievement gap” between African American and Hispanic students and white students was reduced by more than half for both groups.

Graduates Take Rigorous Classes

Not only are more students completing high school, they are graduating with more and tougher classes. According to the Digest of Education Statistics, the average number of units completed at graduation increased by more than five since 1982 (from 21.6 to 27), and almost all of the increase has been in core academic courses. These courses help prepare students for post secondary education.


Adult Educational Achievement


Improving basic skills, graduating more students, and more rigorous courses completed at graduation results in the highest levels of educational attainment ever achieved in this nation.

The U.S. Census Bureau has a wealth of data on the educational status of Americans at this site, including a number of charts such as the following:

Last fall, the Pew Research Center released the report "Record Shares of Young Adults Have Finished Both High School and College," which focused on educational results since 1970. It found significant improvements in levels of post secondary completion for all major population groups aged 25-29 over the past 40 years.

Cost


Americans are clearly getting more from their public school system in terms of high school and post secondary completion, but at what cost?  Certainly, total expenditures have increased, from $40.7 billion in 1969-70 to $559.2 billion in 2010-11. But so has the U.S. economy and personal income to support education.

  • In 1970, total public school expenditures were 4.7% of total U.S. personal income of $864.6 billion.
  • In 2011, school spending was 4.2% of total personal income of $13,191.3 billion.  
  • Americans are spending less of their total income on public schools in 2011 than they were over 40 years ago, but a higher percentage of students complete high school and a much higher percentage complete some level of higher education.  (Source: Digest of Education Statistics, Bureau of Economic Analysis.) 
Note that schools have also significant new responsibilities since 1970, such as special education services and Title IX requirements, which have a major impact on staffing and facility needs.

Kansas leads the national and regional average in educational attainment, while spending below the national average per pupil and at the regional average using the most recent data available.

Tuesday, July 30, 2013

KASB Meetings Collect Views of School Leaders: Teacher Negotiations

Four hundred school leaders attended 24 KASB advocacy meetings held across Kansas in June. Participants were asked to share their opinions on three topics.  Earlier Tallman Education Report posts presented the results concerning school funding and academic standards and testing.  In today's post we'll review the opinions expressed on teacher negotiations.

This discussion was prompted by controversial legislation introduced at the beginning of the 2013 session.  A bill requested by the House Commerce Committee in January would have removed teacher evaluation procedures and teacher assignments for class periods (such as when a district changes daily class scheduling) from the list of items boards must negotiate in districts where teachers have voted to collectively bargain. (This includes vast majority of school districts in Kansas).  The bill would also have made the entire bargaining process itself optional for local school boards.

In testifying on the bill, KASB - as always - looked to the policy positions adopted by its Delegate Assembly.  In the "First in Education, the Kansas Way" resolution adopted last December, delegates from KASB member boards made removal of teacher evaluation procedures from mandatory collective bargaining a priority issue.  Basically, KASB members were concerned that boards will have to "give up something " in the bargaining process simply to comply with new state evaluation standards under development by the State Board of Education.  However, the position adopted by delegates also supported the current requirement that employees being evaluated have input on the evaluation system, provided it’s done OUTSIDE of the collective bargaining process.  Therefore, KASB testified in support of that portion of the bill.

KASB also testified it has a long-standing policy position supporting a much shorter list of topics required to be negotiated than under the current professional negotiations act.  This position dates back many decades and has not been discussed for many years, but it has never been changed by the Delegate Assembly. KASB also testified that this position, in effect, supports a list items which SHOULD be negotiated. Therefore, KASB opposed making negotiations optional for school boards.  As later confirmed by a special meeting of the KASB board of directors, KASB's position is to support continuing to require that boards negotiate with teachers (if requested by teachers under the PNA), but to reduce the number of topics that must be negotiated. (Boards and teachers could still agree to add topics to this list, but only if both parties agree.)

Following a hearing on the first bill, Commerce Committee Chair Marvin Kleeb, R-Overland Park, invited interested parties to recommend changes to the PNA that would improve the process.  At the same time, the results of a Kansas Association of School Superintendents' member survey indicated most administrators would favor a significantly shorter list of mandatory items for negotiations.  KASB staff then worked to develop a new bill to reflect KASB's current positions.  That bill, like the original committee proposal, drew strong opposition from the Kansas National Education Association, which opposed any change in current law.  Ultimately, rather than bringing the bill to a vote on the House floor, the various organizations agreed to Chairman Kleeb's suggestion that the bill be carried over to the 2014 session, and efforts be made during the interim before the next session to find a position that would draw the most support.

With this background, KASB asked participants at the June 2013 meetings to think about this issue in two ways, and then essentially "graph" their position as follows. First, participants were asked to consider a horizontal line representing change in the professional negotiations act.  With current law at the mid-point, each individual was to place a mark representing whether the law should be changed to give teachers more input on the left side, or more board authority on the right.  The further from the center, the more significant the change.

Next, participants were asked to consider a vertical line where the top represented a high priority for change, meaning that it should be strongly pushed regardless of controversy.  The bottom presented a low priority, indicating that any change was not worth the controversy.  KASB staff stressed that any change in the bargaining law would be strongly opposed by KNEA, and very likely most local teacher associations; and that change would only occur if local board members and administrators publicly supported this change with Legislators and others.

To make this point, participants were asked to not only find the "intersection" of their marks on the horizontal and vertical lines, but to also publicly place a colored "dot" on a sheet of  paper to illustrate how they felt about both the degree of change supported and the priority it should receive.  KASB staff then compiled a master list from the charts produced at each meeting.

A couple of points should be noted.  First, not everyone voted with a "dot" - the total is less than the total attendance at the meetings.  Second, participants self-identified as to whether they were board members, administrators, teachers or "others" (a group which includes community members, Legislators and State Board members).

Of the 160 school board members who placed dots, 52% were in the upper right quadrant, indicating support for change to give boards more authority AND a high priority for change.  Thirty-five percent were in the lower right quadrant, supporting change toward board authority, but as a low priority.  Four percent were in the upper left quadrant, supporting change toward teacher input as a high priority, and none were in the quadrant supporting more teacher input as a low priority.  Finally, 7% placed dots either at the exact center or on one of the lines, giving no indication of support for change or priority.

These results indicate that a majority of board members who responded favor changes in the bargaining law to increase board authority as a relatively high priority.  However, it is less clear how much change is supported. KASB staff further divided the chart into three sections on either side of each line.  Forty-one percent of board members were grouped in one section to the right of the vertical line, indicating support for relatively little change, and 37% were in the second section to the right, indicating support for "moderate" change.  Only 9% of board members were in the far right section, supporting the most significant change.

Administrators also favored changes in the law to provide more board authority, but at a somewhat lower priority than board members.  Forty-five percent of the 138 administrators were in the upper right quadrant (change toward boards/high priority) and 43% were in the lower right quadrant (change toward boards/low priority).  Three percent were in the lower left quadrant (change toward teachers/low priority) and 1% were in the upper left (change toward teachers/high priority).  Six percent were on the center or on a line.


Among administrators, 41% were in the first section to the right of center, supporting relatively modest change in the law; 37% were in the next section, supporting moderate change, and 10% in the third section to right, supporting more significant change.

KASB welcomed teachers to attend the meetings, and the 37 who responded to this survey were much more evenly split among the various quadrants.  Only one respondent (3%) was in the upper right quadrant (more board authority/high priority), but 22% were in the lower right (more board authority/low priority). Thirty-two percent of teachers favored more teacher input, but as a low priority, and 20% favored more teacher input as a high priority.  Twenty-two percent of teachers were in the center or on a line, which means over 75% of teacher attending saw changing current law as a low priority, or expressed support for no change or did not indicate a priority.

 Finally, 28 other individuals not identifying with the first three groups attended.  This group also evenly split, with 22% favoring change toward boards as a high priority; 15% change toward boards as a low priority; 23% change toward teachers as a low priority; and 18% change toward teachers as a higher priority. Twenty-six percent of this group was on the center or on the lines.

KASB's Legislative Committee began reviewing this data at its first meeting of the year on July 13. The committee will have to decide whether to recommend changing KASB's position on collective bargaining, and whether to make seeking any change in the law a priority issue for the 2014 Legislative session.

This issue will be discussed at the KASB fall regional meetings, beginning September 24.  KASB also expects to be involved in discussions about this issue with teacher and administrator organizations facilitated by Chairman Kleeb.


Friday, July 19, 2013

KASB Meetings Collect Views of School Leaders: Standards and Testing

Yesterday, I posted a report on how school leaders responded to questions about school finance, budgets and tax policies at 24 meetings around the state last month.  Today, we'll look at what 400 school board members, administrators, teachers and others think about state academic standards and testing.

This topic was prompted by the debate over the Common Core reading and math standards both nationally and in the 2013 Kansas Legislature.  The Common Core standards were developed as a project of the National Governor’s Association and the Council of Chief State School Officers.  The Common Core is not a federal requirement, but the Obama Administrators has create incentives for states to adopt them and provided funding to develop new tests based on the standards, leading to criticism that the project represents a further federal intrusion into education.
The Kansas State Board of Education adopted a modified version of the Common Core standards in 2010, and has incorporated them into the No Child Left Behind waiver.  The Board is in the process of determining a new state testing program based on these standards.  Although not originally controversial, opposition to the common standards movement and related testing initiatives has intensified in recent months.  Several bills were proposed in the 2013 Legislature to stop or “pause” implementation of the new standards and tests.

At the June KASB advocacy meetings, participants were given a survey form with five topics concerning standards and assessments.  For each topic, two opposing statements were given, the first represented by position 1 on a four-point scale; the second by position 4.  Participants were asked to rate how closely they agreed with either position.  Some participants marked between the numbers, with a “2.5” being half-way between the positions, or essentially neutral or undecided.

Should Kansas use academic standards that are common to other states?


In contrast to Legislative concerns, participants overwhelmingly support adopting standards that reflect “common” expectations for college, military service or employment.  


At last 90% of each group leaned in this direction, with nearly 50% of board members and over 60% of administrators choosing “4” or complete agreement.  Teachers/others were more evenly split between “3” and “4,” but only a handful indicated any opposition to common standards.

Should the federal government promote academic standards?


The second topic concerned the role of the federal government in promoting standards.  A “1” meant agreement that the federal government should promote national standards because education in a national interest, even if not a constitutional duty of the federal government.  A "4" means the federal government should have no involvement.


A majority of each group answered “1” or “2,” but the most common response was “2,” which leans toward supporting federal involvement but suggests some concerns.  Only about 20% to 30% of respondents picked "1" or "2," on the side of no federal involvement in educational standards.

Should students be expected to meet the same standards for graduation?


The third question asked whether all students graduating from high school should be academically prepared for a four-year college (“1”) or whether students should be able to choose different standards of postsecondary preparation based on their career interests (“4”).


A majority of all three groups chose “3” or “4,” supporting more flexibility in student expectations.  However, the largest numbers supported “3,” which leans toward that position without complete agreement.  Likewise, between 20% and 30% of each group picked “2,” which "leans" toward having all students meet the same standards.  Less than 10% of each group selected “1,” indicating complete agreement with having all students graduate from demonstrating readiness for a four-year college.

Should districts be able to choose different assessments for state accountability?


The fourth topic concerned whether all districts should be required to use the same state assessments for accountability (“1”), or whether districts could be given flexibility to choose among more than one assessment (“4”).  Kansas is participating in one of two multi-state consortia developing new tests based on the Common Core reading and math standards.  In addition, national testing companies are also developing competing tests, and there is disagreement among some school leaders as to how Kansas should proceed.


Some school leaders have suggested Kansas could pursue idea of allowing districts a choice in their testing program, although it is unclear whether that would meet federal requirements.  However, a majority of each group agreed or leaned toward requiring the same assessment.  Approximately 25% of each group picked “3,” leaning toward allowing district choice, but less than 10% of each group picked “4,” completely agreeing with district flexibility.

How important are standardized tests for accountability?


The final topic concerned the importance of standardized testing in accountability, with “1” meaning that standardized testing is the most important factor in educational accountability and “4” meaning that teaching and local school boards can best determine accountability without standardized tests.


Board members and especially administrators overwhelmingly leaned toward supporting standardized testing.  Teachers/others were much more split, with about one-third leaning each direction and over 25% in the middle.  Despite concerns about over-reliance on testing, a majority of school leaders seem to believe they play an important role in school accountability.

These results indicate school leaders are generally very comfortable with the Common Core standards and the concept of common standards across the state states, whether or not the federal government is involved in promoting such standards.  Board members and administrators are also generally supportive of standardized tests for accountability and a way to measure districts against themselves.  Finally, school leaders lean toward allowing some variation in the expectations for students graduating from high school.

Next, we'll look at school leader attitudes on teacher collective bargaining.

Thursday, July 18, 2013

KASB Meetings Collect Views of School Leaders: Finance

I've made few Tallman Education Report posts since the end of the Legislative session in early June. My excuse is the 24 meetings we held in communities across the state between June 3 and June 28 to discuss education issues with school leaders - a wonderful to spend early summer in Kansas!  Except for a long Independence Day weekend, my KASB advocacy staff colleagues and I then spent most of the last two-and-a-half weeks compiling and analyzing information survey data we collected for the KASB Legislative Committee, which met last Saturday, and writing up the results of that meeting. For next several days, I'll share we learned.
The target audience was school board members and administrative leadership.  A number of teacher leaders and retired teachers also attended; as well as six state Legislators and two State Board of Education members, plus a small number of other community patrons at some meetings.  Final attendance was approximately 400: 45% board members; 38% administrators; and 17% all others, mostly teachers.

The meetings focused on three issues: (1) suitable education finance; (2) state standards and assessments; and (3) collective bargaining between boards and teachers.  Each of these topics included background presentations by KASB staff; a survey instrument to be filled out by the participants individually; and both small and large group discussions of the topic.  We compiled survey results for three major groups: board members, administrators and all others.  Today, I'll report what we heard about school finance.
First, we presented a review of what the Legislature appropriated for K-12 funding for the next two school years (2013-14 and 2014-15), and assumptions used to make projections about state revenues and expenditures for the following three years, through 2018.  In short, these projections indicate that school operating budgets will increase slightly over the next five years, but most likely less than the rate of inflation and enrollment growth.

Is more revenue needed?

Participants were then asked to fill out a form to indicate which of the following statements most closely matched their views: (A) Meeting the constitutional requirement to provide suitable finance for education improvement will require more financial resources; (B) Suitable education finance should be accomplished by reallocating existing resources; (C) Suitable education funding should be accomplished by both increasing and reallocating resources; or (D) Kansas is spending more than is needed to improve education, and funding can be reduced.

Slightly more than half of board members and teachers/others said that suitable funding would require both more resources AND reallocating existing resources, while just under 45% of both groups said more resources were required without reallocation.  Administrators favored more resources alone by 58% to 42%.  A very small percentage of board members and teachers/others said suitable funding could be provided by reallocating existing resources; but no board members or administrators thought resources could be reduced.

How should more revenue be raised?

Next, if participants picked option A, supporting more resources only; or C, supporting both more resources and reallocation, they were asked to choose which tax revenues should be increased to provide the additional resources.  The choices were income, sales or property taxes.  They could also mark "other;" with a space to list alternative suggestions.  More than one source could be chosen.
Governor Sam Brownback and Legislative leaders strongly support reducing and ultimately eliminating the state income tax.  The 2012 Legislative passed a bill reducing state income tax revenue by approximately 25% this year, and the 2013 Legislature passed a bill to further income tax rates through 2018 and beyond.  As a result, projections indicate that state revenues, and therefore school funding, is likely to be essentially flat over the next five years, unless economic growth increases dramatically (or dynamically).  State revenues would be even lower if the Legislature had not narrowly approved an extension of a higher state sales tax rate; a measure opposed by Democrats and most moderate Republicans.
However, participants who believe more revenue is needed to improve education overwhelmingly support raising income taxes, and the second highest level of support is for the sales tax.  It is unclear why there is such a sharp difference between state elected officials and local education officials, since the same voters pick them both.
Interestingly, there was some difference between those choosing revenue only and those choosing both revenue and reallocation.  For those supporting more revenue without reallocation; about 90% of board members and teachers/others picked income tax, and less than 50% of both groups selected sales tax; while about 80% of administrators supporting revenue only picked income tax and 60% favored sales tax.
For those supporting both more revenue AND reallocation, somewhat lower percentages of board members and teacher/others supported income tax (around 74%); and higher percentages of board members supported sales tax (over half of each group).  Among administrators supporting both revenue and reallocation, about 80% supported both income and sales tax.
I suggest these two groups might be called the "purists" and the "realists."  The first group believes schools simply need more funding and cannot be cut without hurting quality.  They are more likely to favor a "progressive" income tax, and don't mind opposing the Governor and majority party.  The second group may not actually FAVOR cutting some areas of school spending to go along with more revenue, but in discussions many said they were just facing political reality.  That group was more willing to support sales tax along with income tax if it is the only way to raise revenue.
Less than 25% of any group supported increasing property taxes to raise more revenue, which could be either an increase in the statewide mill levy or more local funding raised through property tax levies.  


In summary, most most school leaders believe the best way to get more revenue for schools is through the income tax, which the Governor and a majority of legislators want to reduce or eliminate because they believe it will boost the state economy.  The second-best choice is the sales tax, which most Democrats and moderates wanted to see reduced because they believe it is unfair to lower income Kansans.  The worst choice is the property tax.  That may be because school leaders think the PUBLIC hates the property tax most; or because it a tax school boards may have to vote to raise (if the Legislature provides authority to increase their Local Option Budget), or because there is so much disparity in property tax rates - or all of the above.
At least one-third of each group supported "other" revenue sources.  A common suggestion was repealing various tax exemptions, loopholes or credits, which would increase income, sales or property taxes for certain specific taxpayers or groups, rather than a general rate increase. Other common suggestions were to use state lottery or gaming revenues, or to raise "sin taxes" such as levies on alcohol and tobacco.

Where can spending be reduced or reallocated?

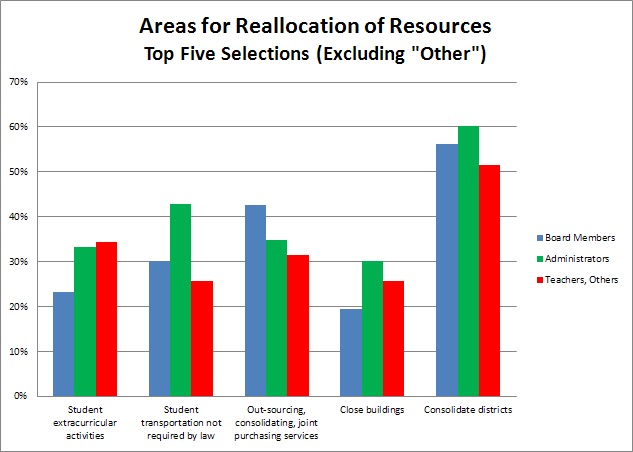
Finally, participants who selected either reallocation of resources, a combination of raising revenue and relocation, or reducing resources were asked to choose among nine school district budget areas for places funding could or should be reduced.  They were also allowed to pick "other" and offer suggestions.

The top five areas were the same for each group, although the order varied somewhat.  The top choice by far for all groups, picked by at least 50%, was consolidation of districts.  That's surprising because district consolidation has long been considered virtually untouchable both in the Legislature and within KASB.  It should be stressed, however, that no respondents offered to volunteer THEIR own districts to be consolidated!

The second highest area for boards and teachers/others and the third highest for administrators was outsourcing or consolidating “non-instructional” services and support functions, including joint purchasing.  This was a major area of interest by the Governor’s School Efficiency Task Force and KASB’s special committee last fall on the same issue; and has been advocated by the Kansas Policy Institute.  Despite evidence that a considerable amount of “sharing” and outsourcing is already occurring, it appears many KASB members believe more can be done.


Others areas ranking high for possible reductions were student activities and transportation for students not required by state law, which could entail student fees.  The final “top five” area was closing buildings.

As far as the least popular areas for budget reductions, between 15% and 20% of each group picked teacher positions for possible cuts, which could include increasing class size, changing scheduling, and reducing courses with low enrollment – choices that could affect students looking for both higher level college prep classes and more specialized vocational courses.  Interestingly, this choice would reduce funding for “instruction” or “in the classroom” spending, but received much more support than cutting leadership (principals, superintendents, etc.) and instructional and student support areas – even from teacher/others.

Although about one-third of respondents marked the category of “other," most of these suggestions were actually duplicates of other categories, plus a handful of suggestions for more revenue at the local level. Multiple respondents proposed reducing state mandates to reduce costs.

Next, I'll look at how school leaders viewed the issue of state academic standards and assessments.