Monday, February 10, 2014

Counting All the Money

The following post is an effort to present in one place something I've never seen before: the total picture of school finance in Kansas over the past five years. School leaders complain about state funding cuts that constrain their budgets. Governor Brownback says his administration has increased state aid to K-12 education. Legislative leaders say they want to "count ALL the money" the state spends on education. The Kansas Policy Institute says Kansas school funding is at an all-time high. The media want to know who is telling the truth.

Everyone is.

This project, which I call "Counting All the Money," is an attempt to put in one place an accounting of all money received or spent by Kansas school districts, where the money comes from and what it can be used for, and how it has changed in recent years.

To do this, I've combined information from the Governor's Budget Division, the Kansas Legislative Research Department, and the Kansas State Department of Education. Although KSDE compiles a total spending report for the state and local school districts, it only break funding into three categories: state aid, federal aid and local revenue. It doesn't explain changes in the mix of how those revenues can be used.

Likewise, the Legislature reports specific "line-time appropriations" for aid programs, but most document do not look at how those funds fit into total district budgets.  Looking only at state aid does not explain changes in other parts of school budgets.

For this project, I focused on four years. First, 2009 was the "high water mark" school funding before the Great Recession.  It was also the final year of funding increases approved by the Kansas Supreme Court to settle the Montoy school finance lawsuit.  That level of funding was designed to provide constitutionally "suitable" school finance.

Second, 2011 was the first year of the Governor Brownback's administration.  That allows a comparison between funding levels that the Governor inherited and what has changed under this watch.

Third, 2014 is the current school year, and 2015 is the upcoming year.  The Legislature  has already approved state aid for these two years, although the Governor has proposing adjustments the Legislature will consider. (In charts below, I refer to 2009 and 2011 as "actual" expenditures, because we know what was actually spent, and 2014 and 2015 as "approved" based on the Legislature's approved budget. However, I also include in total the Governor's new recommendations for both years, and estimates for other parts of the budget.)

To begin with, it may be helpful to think of Kansas school funding in terms of seven “building blocks.”


First, the state provides a “base” or foundation for general operating costs, using a base budget per pupil amount multiplied by weighted enrollment, and funded by a uniform statewide 20 mill property level and state aid.


Second, the state adds funding for a portion of special education costs.


Third, local school districts are allowed to enhance their operating budgets with a local option budget (LOB), financed mostly by local property taxes. However, LOB state aid is provided to over 80 percent of districts to help “equalize” property taxes.


Fourth, school districts receive federal funds for special education and other programs, and for school meals for low income students.


Fifth, the state provides aid to help make bond and interest payments for school construction projects in many districts. This aid has the same purpose as LOB state aid: to somewhat “equalize” the tax burden of constructing school buildings.


Sixth, the state pays the “employer’s contribution” toward the retirement benefits of school employees in the Kansas Public Employees Retirement System.


Finally, districts may raise local revenues for building and construction costs; and charge fees for meals, textbooks, activities and other local purposes allowed by state law .  The total of these seven areas equals total school district expenditures.


I prepared a single spreadsheet that contains all of the following information, but I have broken it down to explain the details of each budget "block." The first chart shows the dollar amount for FY 2009, FY 2011, FY 2014 and FY 2015. The second charts shows the dollar and percent CHANGE from 2009 and 2011 to 2015. In addition, I've color-coded the charts as follows: yellow = the Governor's proposed changes for the current year and next year, blue = a school district budget amount, light pink = state aid appropriations from the state general fund, which is the main "discretionary" budget for the state, and dark pink = state aid from other revenue sources.

Each item explained below has a number in parentheses that matches a funding line in the chart that follows.


District General Fund Budgets


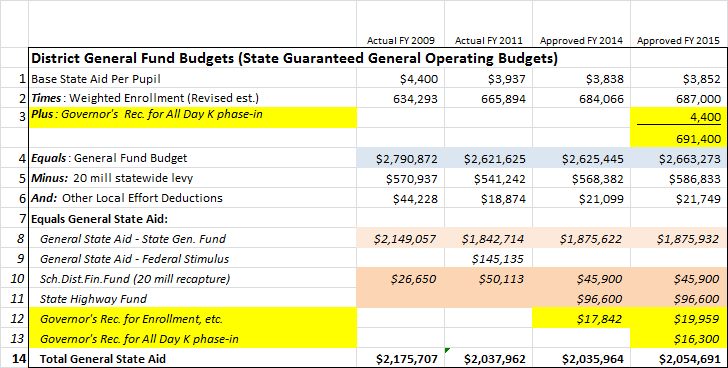
School finance starts with a base budget per pupil (1), which is multiplied by the total weighted enrollment (2).  (Weightings are factors in the school finance formula that provide extra funding based on issues that have been been determined to add costs: low income and at-risk students, bilingual and vocation education, transportation and district size, among others.)

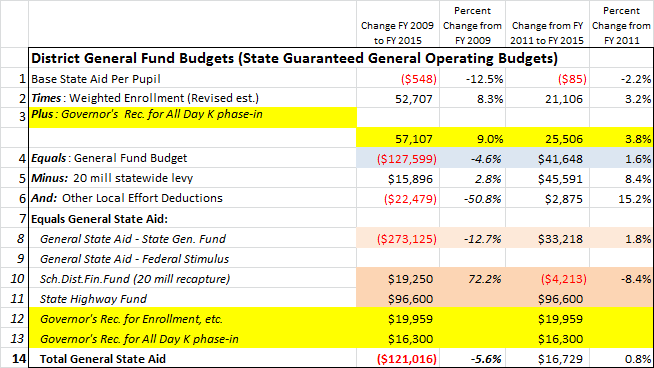
The highest base budget per pupil was $4,400 in FY 2009, which was reduced to $3,937 in 2011. After dropping to $3,780 in 2012, it was increased to $3,838 last year and this year. The base is supposed to increase to $3,852 next year, which would still be 12.5 percent lower than 2009.


Note that weighted enrollment statewide has increased significantly.  While actual “full time equivalent” students have increased by less than 3 percent since 2009, weighted enrollment has increased by over 8 percent. This includes, for example, at-risk weighting based on the number of students qualifying for free meals due to lower family incomes. Total weighted enrollment has increased by over 52,000 students since 2009. (Less than half of that increase has occurred since 2011.) This means that over half of the base increase is not because districts are receiving less money: it is because they didn’t get additional money for the additional weighted students.

Beginning to fund all-day kindergarten, as the Governor proposed, would add another 4,400 weighted students (3).  The increase in weighted students since 2009 has been more than the total enrollment of the largest district in the state (Wichita).


Multiplying the base by weighted enrollment equals the district’s general fund budget entitlement (4).  The general fund budget is the state’s guaranteed amount to fund basic educational programs. Note that the reduction in the base per pupil is a larger percentage than the decrease in the general fund budgets (in blue). That is because although the base is lower, districts can count many more weighted students. However, that has not made up for the cut in general fund budgets since 2009. Even after a base increase last year and scheduled increase next year, statewide general fund budgets remain over $127 million below 2009, or 4.6 percent.  However, if the Governor’s recommendations are adopted, general fund budgets will be $42 million higher than the Governor’s first budget in 2011.

This explains how a school district's general fund budget is determined. But how is it financed?


The general fund is financed first by the 20 mill statewide property tax levy (5), and certain other “local effort” deductions, such as federal impact aid (6). Both are subtracted from the general fund budget amount to produce the district’s general state aid entitlement (7). General state aid is currently funded from three sources: appropriations from the state general fund (8), the school district finance fund, from revenues paid to the state if the 20 mill levy in a district raises more than the district’s general fund entitlement (10), and transfers from the state highway fund (11), which were used to pay for school district transportation weighting in FY 2014 and 2015.

Note that in FY 2011, the state used federal stimulus funds to provide $145 million in general state aid. (9) Since 2009, state general fund support of general state aid has been reduced by $273 million. This has been offset in part by an increase in the state district finance fund “recapture” from the 20 mills, and the $96 million highway fund dollars for both years.  However, state funding has not replace most of the federal stimulus funding that expired. This is why the Governor notes that state funding has increased significantly since 2011, but district general fund budgets are still below were they were in 2009.


Under the formula, if enrollments are higher than expected, or if the statewide levy raises less than expected, the base per pupil is reduced to “fit” the money available.  Both are projected to occur this year and next. To avoid a cut in the base, the Governor recommends adding $17.8 million this year and $20 million next year (12). In addition, the Governor recommends phasing in payment of all-day kindergarten programs beginning next year, which would add 4,400 weighted students, at a cost of $16.3 million (13).  If these funds are added, total general state aid would be still down $121 million, or 5.6 percent, compared to 2009, but $16.8 million higher than 2011 (14).


Special Education State Aid


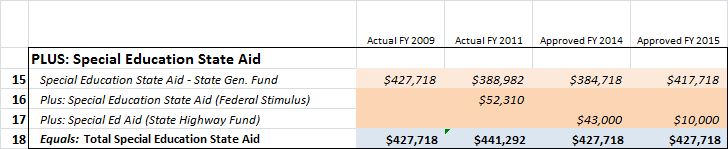
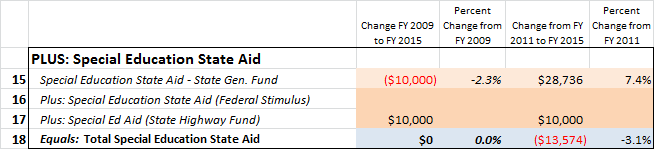
In addition to general state aid for their general fund budgets, under state law districts are supposed to receive special education state aid to pay 92 percent of the “excess” of serving special needs students. However, current funding is only about 80 percent of this formula.  Special education aid is currently financed by two sources: state general fund appropriations (15) and state highway fund transfers to cover special education transportation costs (17). (In 2011, federal stimulus funds paid for $52 million of special education costs. [16])

Total special education aid (18) is unchanged since 2009, which is required by federal “maintenance of effort” requirements.


Local Option Budgets


Districts are allowed to adopt a local option budget of up to 31 percent of their general fund budget plus special education state aid. This total increased from about $900 million in 2009 to over $1 billion (19).  (Under current law, districts calculate the general fund as if the base was $4,433, the budgeted level in 2009, rather than the actual amount, in order to avoid reducing the LOB as the base was cut.)  Total LOB use in 2015 is projected to be $131.3 million higher than in 2009, which would offset the overall reduction in general fund budgets (4).  However, many districts could not do so because they reached the LOB maximum.


The LOB is financed by two sources: state aid and local property taxes. LOB state aid, called supplemental general state aid (20) is provided to districts based on their taxable property wealth per pupil (the highest-wealth districts do not receive any aid).  Whatever portion of the LOB is not funded by state aid must be raised by a local property tax (21).

Because LOB state aid has been increased by only $15 million since 2009, property taxes have paid for most of the increase in the LOB: $116 million or a 20.1 percent increase.  LOB state aid is about $100 million short of the formula amount.  Increasing LOB state aid in most districts would reduce local property taxes, not increase district budgets (unless the maximum was raised).




Federal Funding


School districts also received federal funding.  (The chart below does not include federal stimulus funding for 2011, because those dollars were included above in general state aid and special education aid.)  The portion of federal funding actually used for classroom instruction and student and teacher support programs, such federal special education aid and "Title I," has declined by $36 million (22).  However, federal aid for lunch and breakfast support for low income students which has increased by almost 70 percent (23). Total federal funding has increased 9.3 percent since 2009, but has declined by 3.6 percent since 2011 (24).




State Aid for Capital Expenditures


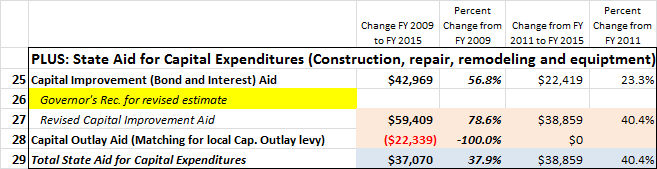
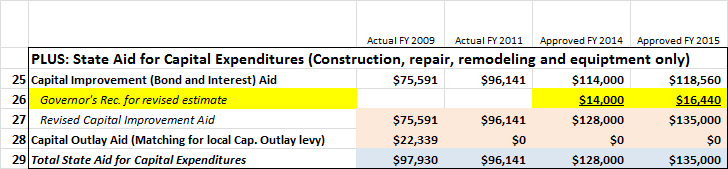
In addition to the LOB, districts that have issued bonds for building construction or remodeling may qualify for state capital improvement aid based on their property wealth (25).  This program has increased substantially since 2009, and the Governor is recommending that $14 million be added this year and $16.4 million next year to pay for higher than expected costs (26).  If approved, capital improvement funding will have increased $59.4 million, or 78.6 percent, since 2009 (27).  However, none of this money can be used for regular operating expenditures - essentially, it is used to reduce property taxes in lower wealth districts.


Although the state has increased funding to help pay for construction bonds since 2009, it has stopped providing any funding for another program, capital outlay state aid, which matched local property tax levies for construction and equipment financed without debt.  Eliminating that program reduced state expenditures by over $22 million (28).  The net funding for both programs has increased about
40 percent since both 2009 and 2011 (29).


KPERS Funding


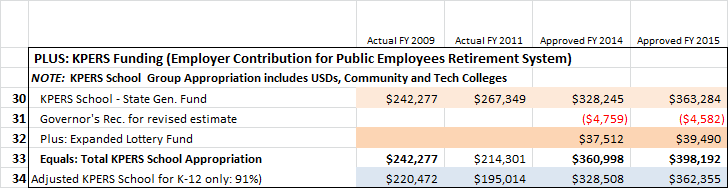
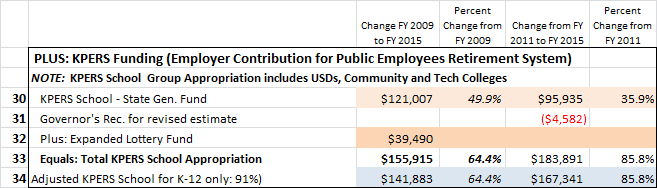
The final major state aid program is contributions for school employees under the Kansas Public Employees Retirement System. The state appropriations to the “school group” covers employees of community colleges and technical colleges, as well as K-12 school districts (30). The state contribution is a percentage of employee salaries. The Governor is recommending reductions in this appropriation in the current year and next year, based on new estimates of lower than expected salaries (31). In addition to state general fund appropriations, the Legislature approved using revenues from the expanded state lottery fund to help pay for KPERS in FY 2014 and 2015 (32).


Total state aid for KPERS schools has increased significantly - $156 million or 78.6 percent - as the Legislature seeks to reduce the unfunded liability in the system (33). To add this amount to total school district spending for this analysis, we assign 91 percent of the total amount to school districts, excluding payment for college employees (34). These funds simply “pass through” the district budget. They cannot be used for regular operating costs.


The total of these budgeted state and federal revenues has increased by $221 million since 2009.  However, this increase has been entirely funded in three areas: higher capital improvement aid for school bonds; higher KPERS contributions; and increased federal funding for student meals (35).




All Other Local Spending and Total Spending


The part of school budgets listed above can be estimated fairly accurately because of enrollment projections and state appropriations. However, it is more difficult to estimate total school spending for the current year and next year.  Total spending includes local decisions about bond payments, capital outlay spending and fee-funded revenues for meals, textbooks and activities (36).  These expenditures may not be finalized and are not reported until the end of the year.

For this analysis, we estimated that total school budgets will increase by about 1.5 percent in both 2014 and 2015 (37), the same rate as 2013.  If that occurs, it would mean total spending would have increased by $362.6 million over 2009, or about 6.4 percent, and all other local spending would have increased by $141.6 million. Most of this "other" spending is for debt payments, capital costs, or fees for meals or other restricted purposes. Almost all of these revenues are from local property taxes or fees charged to students and their families. Almost none of these can be used for regular educational costs.



Key Trends in School Funding: State Aid


Under the Governor’s budget, total K-12 state aid to school districts from the state general fund would be $3.16 billion in 2015, down $78 million from 2009 (38).  However, state aid from other funds - mainly the state highway fund - has increased  $165.3 million (39).


Under the Governor’s budget, total state aid from all funds (excluding federal stimulus funding) in 2015 would have increased $87 million since 2009, and $370.8 million since his first budget in 2011 (40).  Where have those increases been directed?


Since 2011, over half of that increase has been KPERS aid (up $167.3 million) and capital Improvement aid (up $39 million) - which cannot be used for regular operations.  For school district general fund, or operating budgets, General state aid from the state general fund already appropriated is up $33 million and the state highway fund $96.6 million, and the Governor’s new budget proposal would add $20 million for increased enrollment and $16.3 million for the first year of all-day kindergarten.  However, this increase of $165.9 million is offset by the loss of $145 million in federal stimulus funding in 2011.  That is why school operating budgets are still down, even though total state aid is up.


The net cost of the Governor’s recommendations this Legislative session is $27 million more in FY 2014 and $48 million more in FY 2015 (41).


Trends in School Funding: State and Local Balance


Next, let’s look at some other trends in school funding.  Total aid from the state has dropped from
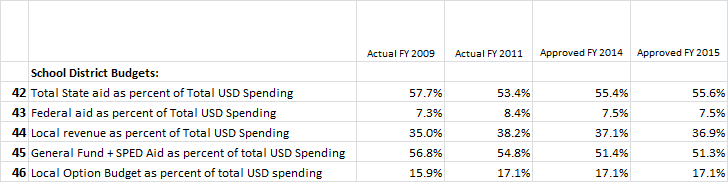
57.7 percent to 55.6 percent of total school spending (42), while federal aid has risen just slightly (43) and local revenues increased from 35.0 percent to 36.9 percent (44).  It’s worth noting that Kansas has long ranked high among states in terms of the
percentage of budget from state funding.  This was done to reduce reliance on property tax, and to equalize differences in tax rates resulting from differences in local property valuation.  Kansas seems to becoming more like the rest of the country, with more reliance on local revenues for school funding - at a cost of higher local property taxes, especially in lower-wealth school districts.


The share of total spending funded directly by the state for annual operating budgets - the general fund and special education aid - dropped from 56.8 percent in 2009 to 51.3 percent in 2015 (47), while the LOB increased from 15.9 percent to 17.1 percent (48).  Local property taxes have increased to make up for reductions in state operating funds.


K-12 State Aid and the State General Fund

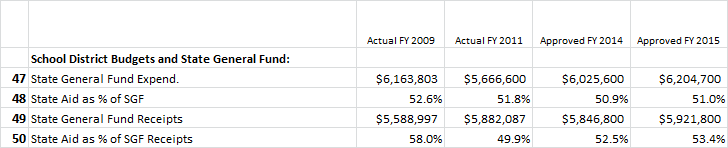
Under the Governor’s budget, total state general fund expenditures for all state programs in FY 2015 would be just slightly above the 2009 level by $40.9 million or 0.7 percent (47). Since total state aid from the state general fund has declined by $78.3 million (38), the share of the state general fund going to education has declined from 52.6 percent to 51.0 percent (48).  In 2009, as well as in 2014 and 2015, the state was spending more from the state general fund than was coming in through revenues (49), and state aid dropped from 58 percent of state general fund receipts in 2009 to 53.4 percent in 2015 (50).


School Funding and Kansas Personal Income

Based on projections adopted by the state Consensus Revenue Estimating Group, Kansas personal income - the total of all income from all sources received by Kansans - is expected to reach $136.8 billion in 2015, almost 25 percent higher than in 2009 (51).  State aid for K-12 education has declined from 3.0 percent of Kansas personal income in 2009 to an estimated 2.5 percent in 2015 (52).  School operating budgets, including the general fund, special education state aid and local option budgets, have declined from 3.8 percent to an estimated 3.0 percent (53). Total district spending dropped from 5.2 percent to 4.4 percent (54). By every measure, Kansans are spending a smaller percentage of total income on K-12 education.



Inflation Rate

Since 2009, the consumer price index (CPI), or inflation rate, increased just over 13 percent, or slightly more than half the increase in personal income (55).  The CPI has increased nearly 8 percent since 2011.  To adjust any of the amounts in these charts for inflation, add 13.1 percent to 2009 figures and 7.9 percent to 2011 figures to compare to 2015.  (The inflation rate through 2015 is based on the November 2013 Kansas consensus revenue estimate.)



Funding Per Pupil

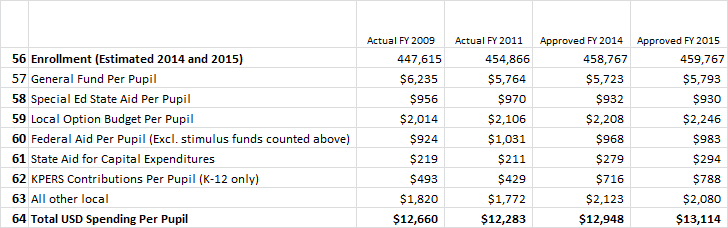
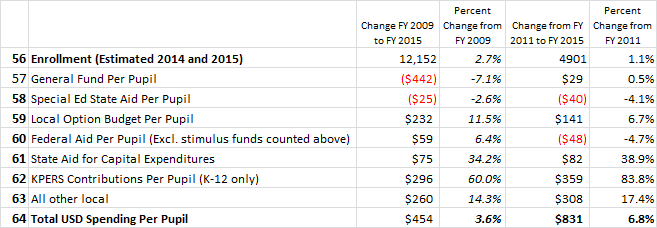
As noted above, student enrollment has increased 2.7 percent since 2009 and 1.1 percent since 2011 (56). Converting total spending amounts to actual per pupil (not weighted) amounts, general fund spending has declined by $442 or 7.1 percent compared to 2009 (57). Special education state aid per pupil is down 2.6 percent since 2009 and 4.1 percent since 2011 (58). Increased local option budgets have offset about half the general fund per pupil reduction since 2009 (59). Federal aid has increased since 2009, but has dropped since 2011 (60).


The only areas of districts that have increased more than inflation on a per pupil basis are state aid for capital expenditures (61), KPERS contributions (62) and other local expenditures (63).


Total spending per pupil has increased 3.6 percent since 2009, and 6.8 percent since 2011 (64).  This means total spending per pupil is 9.5 percent less than the rate of inflation since 2009 and about 1 percent less than inflation since 2011.


Tuesday, January 21, 2014

The Quarter-Million Dollar Classroom

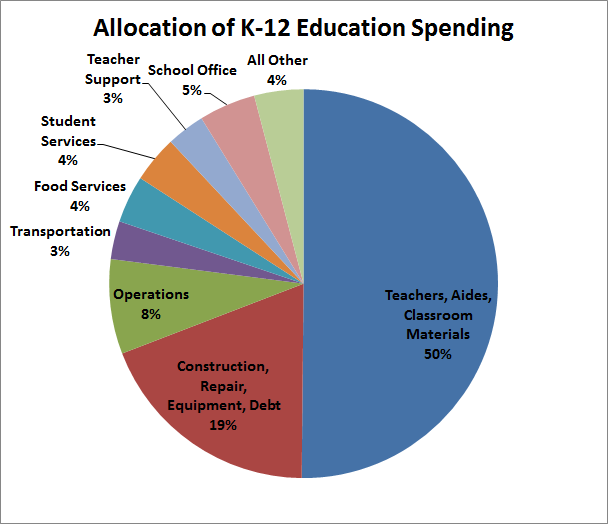
In his 2014 State of the State Address, Governor Sam Brownback noted the people of Kansas provide over $12,500 per K-12 student, or about $250,000 for a classroom of 20.  What is that money being spent on?  More important, what are Kansans receiving for that investment?

Start with the teachers.  Thanks to efforts to keep classes small, the average class size in Kansas is less than 20 students.  Including special education staff assisting children with special needs, there are 1.5 teachers for every 20 students.  Adding special education paraprofessionals and other classroom aides to assist these teachers, there are almost two instructional positions for every 20 students.  Kansas had the 18th lowest pupil to teacher ratio among the 50 states in 2010, the year of the most recent national data.

Salaries for teachers and classroom aides, along with textbooks and instructional supplies, make up just over half of that quarter-million dollars: about $125,000.

The next largest share of classroom costs is the classroom itself, along with the rest of the school building: the library, gym, auditorium and lunchroom, as well as equipment like computers to go with textbooks and chalkboards. On average, Kansas spends $50,000 for every 20 students for buildings and equipment, including payments on construction bonds. That brings the total to $175,000.

Once constructed, schools also must be maintained and operated. Kansas spends about $20,000 for every 20 students for heating, cooling, and cleaning school facilities, as well as keeping them safe and secure. That brings the running total of classroom costs to $195,000.

Next, students have to get to school.  For every 20 students, Kansas spends $8,000 for transportation.  State law requires transporting children who live more than 2.5 miles from school, and many more are bused for safety reasons.

Schools also provide meals for students. Lunch and breakfast programs cost about $10,000 for every 20 students, including fees paid by students and staff. These fees are also part of the total cost per pupil.  Adding transportation and meals, the classroom total is now $213,000.

In addition to teachers, schools also provide counselors, social workers, psychologists, speech pathologists, audiologists, nurses, attendance and resource officers and security staff. Counting their support staff, Kansas schools have one of these student support positions for every six classrooms of 20 students, at a cost of $10,000 for a class of 20.

Schools also need libraries, technology support and programs to continuously improve teaching and learning. Kansas spends about $8,000 per classroom on these services, bringing the total to $231,000.

In charge of each school is a principal and his or her staff.  These individuals supervise and evaluate teachers and other school support staff, oversee student discipline, and relations with parents and the rest of the school staff.  In small schools, the principal is also responsible for many of the duties listed above.  Kansas spends about $12,000 for every 20 students on school leadership - or about one principal or assistant for every 160 students.  That brings the total to $243,000.

All other expenditures - about 4 percent of the total - are the remaining administrative costs, including the superintendent, business office, human resources and legal costs.  In small districts, the superintendent is often also a principal and handles these duties and more.  Most districts participate in cooperative organizations to share many of these functions and reduce costs.


According to the most recent national data, Kansas provides about $1,000 less per student from all sources than the national average, or $20,000 for a classroom of 20 students.  Kansas spends less per pupil than neighboring states like Nebraska, Iowa, North Dakota and Minnesota.

However, Kansas ranks eighth in the nation across multiple achievement measures, including national reading and math tests, graduation rates, preparation for college and adult educational attainment.  Among neighboring states, only Minnesota and Colorado have higher adult completion of high school, four-year college degrees and advanced or professional degrees.

Total school spending in Kansas in 2013 was 4.6 percent of total personal income in Kansas - compared to 4.9 percent 20 years ago.  However, since 1990, the adult high school completion rate has increased from 81.3 percent to 89.5 percent, four-year degree completion from 21.1 percent to 29.8 percent, and advanced degree completion from 7.0 percent to 10.2 percent.  Kansans are getting better results while actually spending a lower percentage of total taxpayer money.

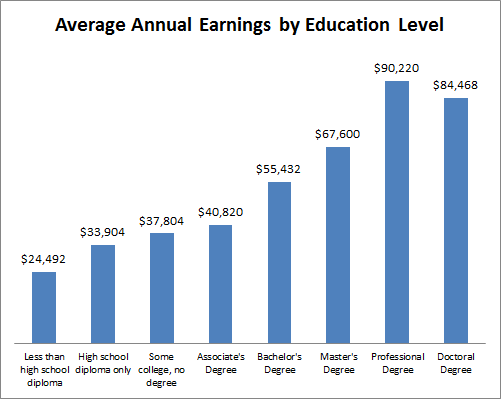
A quarter-million dollars is a big investment in a classroom of students.  But the payoff is even bigger.  The earnings difference between a high school graduate and a high school dropout is around $10,000 per year.  If 90 percent (18) of those students graduate, that class will earn $180,000 more per year.  If 30 percent (6) of those students receive a bachelor’s degree, they will earn another $20,000 per year, for a class total of $120,000 per year.  If 10 percent (2) of those 20 students get an advanced degree, they will each earn at least another $10,000 per year.

That means a total additional earnings of $320,000 for a class of 20.  If each individual works, on average, about 3.5 years for every year spent in K-12 schools, that class will earn at least $1,120,000 more over their lifetimes, or over a $1 million return on a quarter-million dollar classroom investment each year for K-12 education.


Notes and sources:
Total spending per pupil is from Kansas State Department of Education data.

Numbers of teachers and other staff are from KSDE reports.  The Tallman Education Report blog post for Oct. 25, 2013, "Setting the Record Straight on School Employees and Spending," contains a table showing statewide district employees by budget categories for 2012-13.

The allocation $250,000 per classroom of 20 students is based on the most recent KSDE report of current operating expenditures by budget function, with percentages adjusted to reflect total expenditures.  The difference between total expenditures and current operating expenditures is the amount used to determine capital expenditures for construction and equipment and debt service.

Data on state and national expenditures per pupil is from the U.S. Census Bureau for the most recent year available (2011).

Kansas’ ranking of eighth in the nation on multiple educational measures is based on KASB’s analysis of National Assessment of Educational Progress test results, graduation rates, ACT and SAT scores, and adult educational attainment.

For total school spending as a percentage of Kansas personal income, spending data comes from KSDE and income data from the Bureau of Economic Analysis.

Adult educational attainment data is from the Digest of Education Statistics.

Average annual earnings for levels of educational attainment is from the Bureau of Labor Statistics’ most recent report on median weekly earnings, multiplied by 52 weeks.

Wednesday, January 8, 2014

News and Opinion: Court Case, Common Core, Instructional Spending

Here are several new items from Kansas and around the nation.

The New York Times has an Op Ed column on the Kansas school finance case from the executive director of the Education Law Center and the president and executive director of the Leadership Conference on Civil and Human Rights.

The U.S. Chamber of Commerce has called for support of the the common core academic standards, as reported in an Education Week blog.

However, Polico reports on efforts by national conservative organizations to oppose the common core standards as the first step in efforts to expand charter schools and vouchers, and eliminate the U.S. Department of Education and teacher tenure.

The Kansas (state) Chamber of Commerce released a poll covering a number of issues, including a question about increasing spending on instruction.  This Lawrence Journal World article reports on controversy of the percentage of funding spent on instruction, and has links to the full survey.


Thursday, January 2, 2014

Analysis of new Kansas Policy Institute opinion poll

UPDATE: After this bog was posted on January 2, the Kansas Policy Institute informed KASB on January 3 that a statement would be issued regarding the first question in the opinion survey reported below. KPI indicated a portion of the question was based on a misunderstanding of current law regarding Local Option Budget authority.

The Kansas Policy Institute recently released a public opinion survey (PDF Version) asking a series of questions about school funding, local advocacy and litigation, school standards and support for charter schools and private school vouchers.  Responses indicate public support for many of KASB’s core positions on higher standards, suitable school funding and stronger local leadership.  However, in some key areas, those responding to the survey appear to disagree with some key KASB positions.


The following is a quick review of the poll results, with a particular focus on how responses compare to KASB policy positions adopted by member school boards, and other recent opinion surveys.  (See an in-depth review of three national opinion polls released earlier this year in the Tallman Education Report.)


The new poll was conducted by Survey USA December 18-19 for the Kansas Policy Institute. Two-thirds of the respondents were reached by home telephone and interviewed in the recorded voice of a professional announcer.  One-third were shown a questionnaire on smartphone, tablet or other electronic device.  Five hundred adults statewide were interviewed.


The results appear to be generally reflective of the Kansas population by age.  However, compared to party registration figures from the Kansas Secretary of State’s office for the 2012 election, the survey under-represented Republicans and over-represented Democrats and Independents.  This page provides a link to 2012 October Registration numbers.


The survey also appears to significantly over-represent persons with a four-year college degree, indicating 50% of the respondents had four years of college, compared to just 30% of the Kansas population 25 years and older.  (U.S. Census Bureau: American FactFinder.)


Response to School Finance Litigation


Question 1 asked: “A state court has effectively ordered legislators to increase school funding by $443 million, which would also automatically increase local property taxes by another $154 million.  Regardless of whether you believe schools are adequately funded, how would you respond to this statement: It is appropriate for the courts to have final say on decisions of how much taxpayer money is spent on education.”


KASB disagrees with the premise that the district court ruling would “automatically increase local property taxes by another $154 million.”  This is apparently based on raising the base budget per pupil from $3,838 to the statutory level of $4,492.  With LOB’s capped at 30% of base aid in all but 10 districts (which are capped at 31%), such a base increase would theoretically allow an increase of $154 million in LOB authority. (UPDATE: KPI has indicated the survey used an assumption of a $154 million LOB property tax increase based on this methodology. This assumption is incorrect, as explained below.)


However, districts are currently allowed to calculate their LOB using a hypothetical base of $4,433. This measure was approved by the Legislature to avoid LOB cuts when base state aid was reduced.  If the court orders the Legislature to fund the base at $4,492, districts would only receive an increase of $59 per weighted pupil for purposes of calculating the LOB.  Assuming a weighted enrollment of 786,000 (including special education aid), this would result in an increase of just $46.4 million on which the LOB can applied.  With an average LOB of 30%, this would provide about $14 million in new LOB authority.


However, the lower court also ordered full funding of LOB state aid, currently underfunded by over $100 million.  If additional LOB budget authority is provided, a portion should also be funded by state aid. Therefore, even if LOB authority increased $14 million, fully funding state aid would reduce property taxes by at least $86 million in the 81% of districts that receive LOB state aid.  Therefore, rather than “automatically” increasing property taxes by $154 million, the court order could lower property taxes by more than $86 million statewide.


Despite the inaccurate assumption of property tax increases, among all respondents, 47% either strongly or somewhat agreed that the courts should have the final say on decisions of how much taxpayer money should be spent on education, while 50% strongly or somewhat disagreed - within the 4.5% plus or minus margin or error.  A majority (55%) of those under age 50 agreed that the court should have the final say on the amount of education funding, while a higher majority (63%) of those 50 and older disagreed.  A majority of those with a four-year degree (51%) and those making over $80,000 per year (61%) also agreed.  Although the percentages were generally close between those who agreed and those who disagreed, higher percentages generally “strongly disagreed” than “strongly agreed.”


Question 2 asked: “And how would you respond to this statement: It is appropriate for the courts to have final say on decisions of the specific way in which taxpayer money is spent on education.”


Higher percentages of respondents opposed this statement than Question 1, with 36% strongly or somewhat in agreement, and 62% strongly or somewhat in disagreement.  Again, those with the most education and highest incomes were more likely to support the court’s role.


KASB believes the courts should be able to interpret article 6 of the Kansas Constitution, which requires the Legislature to “make suitable provision for finance of the educational interests of the state,” and require corrective action if the Legislature is found to have failed in this duty, just as the courts may require school districts to spend money or take other action if they are found to be violating laws or contracts.  However, KASB has not supported either the courts or the Legislature directing specific educational expenditures.


Question 3 asked: “If the Kansas Supreme Court orders an increase in taxpayer funding to public schools, what would you most want to see the legislature do in response? Increase your property taxes?  Increase your sales taxes? Increase your income tax? Reallocate spending from other parts of government to get more money into classrooms? Try to find more efficient ways to spend the money already allocated to schools? Or something else?”


The respondents were not allowed to choose more than one option.  The top choice was reallocate spending from other parts of government (36%), followed by finding more efficient ways to spend money already allocated (31%).  Less than 30% supported raising taxes, 13% supported an increase in the state income tax, 10% an increase in sales tax, and 4% increasing property taxes.


This indicates that only about one-third of Kansans support “finding efficiencies” within the school system - which really means cutting some areas within the public school system to give to others.  For example, “efficiency” could translate into further district consolidation and losing your community’s control over local schools, closing more schools in your small town or neighborhood, cutting local jobs and contracts to outsource services.  These may sound like good ideas in the abstract, but look different when it actually happens in your community.  


On the other hand, a majority in the KPI poll support either increasing education aid by shifting funding from other areas of the state budget or raising taxes.  That suggests a majority of Kansans want to see school spending either increased or at least left at current levels.


It’s interesting to compare these results with the 2013 Kansas Speaks survey by the Docking Institute at Fort Hays State University.  It found that two-thirds of Kansans favor increased funding for K-12 education and another 27.5% want funding to remain the same.  It also found that 50% of Kansans favor increased spending on social services, and 45.1% favor increased spending on higher education.  Only 6.0% of Kansans favored decreased funding for K-12 education, 6.2% for social services and 12.7% for higher education.


At the same time, Kansas Speaks found that 44.5% of Kansans want OVERALL state spending to be REDUCED, while only 25.2% want state spending increased.  In other words, while 50% to 60% of Kansans want to spent more on K-12 and social services, only 25% want to increase total state spending.  To put it another way, Kansans want to spend more on specific programs, but not on overall government.  That may be why the new KPI survey found the strongest support for reallocating spending from other areas of government if the court orders increased funding for K-12 education.


However, the three areas of government spending that survey respondents told Kansas Speaks should be either increased or remain the same already account for 88% of the current state general fund budget (K-12 49.2%, higher ed 12.6% and social services 26.2%), according the Kansas Legislative Research Department’s 2013 Fiscal Facts report.  Most of the remaining funding in the state general fund goes to public safety and corrections.  For more information on the state budget picture, review the Kansas Health Policy Institute’s "Budget Puzzle."


Lobbying and Lawsuits


The next two questions asked about the use of public funding for lobbying and school finance lawsuits.


Question 4 asked: “Should counties, cities, and school districts trying to lobby the legislature for a particular policy be allowed to use tax dollars to pay for their lobbying?”


Seventy percent of respondents answered “no,” with just 16% responding yes and 14% not sure.  Those with more education and higher incomes were more likely to favor allowing public funding for lobbying, but a strong majority opposed the issue in each case.


KASB believes school districts should be allowed to use public funding for “lobbying,” which we believe to be communication between one level of government (local elected schools) and another (elected state legislators).  The question is how survey respondents define “lobbying,” which may suggest gifts, entertainment and contributions that most local governments and their associations are not involved in.


Question 5 asked: “Should local school districts filing lawsuits seeking more tax money be allowed to use tax dollars to pay for their lawsuits?”


The results were very similar to question 4, with 71% opposed to school district financed lawsuits and 19% in favor.  However, when asked a similar question, the Kansas Speaks poll found that 61% of Kansans believe such lawsuits SHOULD be allowed, and only 39% opposed. (See link above.)


KASB believes school districts should be able to use public funds to challenge Legislative actions under the state constitution, just as the Legislature may use public funds to challenge federal laws under the U.S Constitution.  School boards are accountable to local voters for the use of tax funds.


Education Standards


Question 6 asked: “Do you favor or oppose the Common Core Educational Standards, referred to in Kansas as the College and Career Readiness Standards?”


Although Common Core standards have become very controversial both in Kansas and nationally with strong opposition from some conservative organizations and leaders, the KPI survey found that 38% of respondents strongly favored or favored the new standards, 34% neither favoring nor opposing and only 16% opposed or strongly opposed.  Another 12% had no opinion or were unsure.


These results are generally similar to national opinion polls released this summer, which found a higher percentage of the population with little awareness of the Common Core or no opinion; but among these with an opinion, support was higher than opposition. (See link to Tallman Education Report above.)


KASB strongly supports the implementation of higher standards for Kansas students, and believes the Common Core standards support that goal.


Question 7 asked: “Who should make academic standards and curriculum decisions for Kansas schools? Local school districts? The Kansas State Department of Education? National non-governmental organizations? Or, the federal government?”


The state department of education just edged out local school districts, 41% to 39%, which is within the margin of error.  Only 8% picked non-government organizations, and 5% the federal government.  Older respondents, Republicans and Independents were more likely to favor local school boards.  Interestingly, union members, those with only a high school diploma, those with a four year college degree, and those with the highest incomes were more likely to favor the state department of education.


KASB believes the question ignores the difference between standards and curriculum.  KASB supports the State Board of Education setting statewide academic standards, but believes local school boards should determine the curriculum taught in schools.  The difference is that standards are the goals or outcomes, while curriculum is the means to reach those goals and outcomes.


Question 8 asked: “Who should decide what qualifications are needed to teach in Kansas schools? Local school boards? Or the state legislature?”


Overall, 49% favored local school boards and 41% the Legislature.  Of all groups, only union members, those with four-year college degrees, and political liberals picked the Legislature.


However, the question does not address the fact that in Kansas, teacher licensure decisions are made by the State Board of Education, based on previous decisions of the Kansas Supreme Court regarding the powers of the state board.


KASB supports a state system of teacher licensing and supports the current constitutional powers of the State Board.  However, KASB also supports allowing local districts more flexibility in hiring individuals who may not have completed all traditional requirements but demonstrate competence through performance.


Direction of Kansas Public Education


Question 9 asked: “Thinking about student achievement in Kansas ... are things in Kansas public schools generally headed in the right direction? Or are things off on the wrong track?”


Those responding were almost evenly split on this question, with 36% saying right direction, 38% saying wrong track, and more than one in four (26%) not sure.  Younger respondents - those most likely to have children in school - were more likely to see things positively.  Those under age 50 said right direction over wrong track, 40% to 29%, while 48% of those 50 and older said wrong track compared to 32% who said right direction.  Republicans were evenly split 42%-42%, while Democrats favored right direction 43% to 26% and Independents favored wrong track 45% to 26%.  Conservatives picked wrong track 53% to 28%, while moderates favored right direction (43%) over wrong track (28%) and liberals said right direction over wrong track 47% to 26%).


This question differs from most national opinion surveys because it asks about Kansas public schools generally.  Most surveys find that respondents - especially parents - grade their local public schools or schools their children attend fairly high (A’s or B’s), but grade public schools nationally much lower.  This survey did not differentiate between local or community schools and schools across Kansas.


The survey also did not ask WHY respondents believe schools are going in the right direction or off track.  For example, one could answer “wrong track” because of concerns about “failing” public schools, low standards, lack of discipline, etc.  However, one could also believe student achievement is on the wrong track because of state funding cuts, larger class sizes, and closing community schools.  Another concern is that an over-emphasis on testing basic reading and math skills has narrowed curriculum choices.


KASB data indicates that Kansas public schools have improved in virtually every consistent education measure over past decades, especially given the more challenging student population public schools now serve.  However, KASB believes Kansas must continue to increase the percentage of students who graduate high school and are prepared for college and career requirements.  Unfortunately, student achievement has leveled off in recent years - at the same time funding has also leveled off or declined in inflation-adjusted terms.


School Choice


Question 10 asked: “If you were deciding where to send a child to school, and cost was not a factor, what type of school would you choose to get the best education for that child? A traditional public school?  A traditional public magnet school? A public charter school? Or a private school?”


A majority of respondents picked some form of public school: 41% said traditional public school, 9% said traditional public magnet school, 5% said public charter school.  However 41% picked a private school.  That is about four times the rate of private school enrollment - in Kansas, approximately 10% of students historically have attended private schools (including home schools).  Younger respondents, Democrats, liberals, those with high school education only AND those with a four year degree were more likely to pick public schools.


Again, this question does not ask WHY respondents selected their response.  KASB research indicates that, based on state and local testing, private schools have similar results to public schools WHEN DIFFERENCES IN STUDENT DEMOGRAPHICS ARE TAKEN INTO ACCOUNT.  However, respondents may favor private schools for other reasons, such as religious instruction, that public schools cannot address.


Question 11 stated: “Charter schools are public schools that have more control over their own budget, staff, and curriculum, and are exempt from many existing public school regulations.”


The survey indicated that 47% strongly favored or favored (presumably referring to charter schools), 28% neither favored nor opposed, 9% strongly opposed or opposed, and 7% offered no opinion or were not sure.


These responses in support of charter schools are similar to or actually lower than national views of charter schools reported in several surveys this fall.  National polls have long shown support for the “idea” of public charter schools, but there is considerable confusion over what exactly charter schools are.  That is probably because there is a wide range of charter school laws in states across the country, including Kansas.


KASB believes the crucial issue in charter schools is accountability to both state standards and local voters and parents.  The Kansas Constitution indicates that all public schools are under the “general supervision” of the State Board of Education and are to be “maintained, developed and operated” by local elected boards.  KASB supports giving local boards more freedom from state school regulations, in return for higher standards of accountability.  That includes allowing local communities to give public school more control over their budget, staff and curriculum.


Question 12 stated: “A school voucher system allows parents the option of sending their child to the school of their choice, whether that school is public or private, including both religious and non-religious schools. If this policy were adopted, tax dollars currently allocated to a school district would be allocated to parents in the form of a "school voucher" to pay partial or full tuition for their child's school.”


The survey found that 40% of respondents strongly favored or favored, 23% neither favored or opposed, and 31% opposed or strongly opposed.  More Republicans were opposed or strongly opposed (40%) than Democrats (37%) or Independents (25%).


Question 13 asked: “Sticking with the idea of taxpayer money following individual students, would you support some version of a school voucher to be used for selected student populations such as special needs students, low income students, or students from chronically underperforming schools?”


This question suggests a policy that would offer vouchers only to a limited number of students.  Support for this question was higher than question 12, with 53% answering “yes” compared to 40% strongly favoring or favoring vouchers in question 12.  However, about the same percentage (30%) answered “no” to question 13 as opposed or strongly opposed vouchers in question 12 (31%).  Interestingly, Democrats were more likely to respond yes (57%) than Republicans (53%) or Independents (50%), and Liberals were more likely to answer yes (62%) than moderates (54%) or conservatives (51%).


These rates of support for public funding of private education options are generally higher than national results in polls released this summer.


KASB opposes public funding for private schools that do not have to meet state accountability and operating requirements for public schools or serve all students on an equal basis.  These questions do not address the issue of whether the parent could really choose a non-public school, or whether that choice would ultimately be made by the school through admissions policies or other requirements.  In addition, the Kansas Constitution specifically prohibits public education funds going to religious organizations.