Thursday, March 27, 2014

Impact of New Senate Republican School Finance Proposals

Two approaches to addressing the Gannon school finance decision were presented at the Republican Senate Caucus Wednesday.  Both would finance the nearly $130 million estimated cost of fully funding the Local Option Budget and Capital Outlay state aid in part by making significant cuts in other school funding areas.  Both would also increase the maximum LOB authority for districts.  The net impact on individual school districts would vary significantly.

The first proposal was offered by Senate Republican leaders.  The second was a variation offered by Senate Ways and Means Chair Ty Masterson, R-Andover.  Spreadsheets showing the impact of both plans were presented yesterday to Republican Senators, as well as a spreadsheet of the Democratic proposal to simply add $130 million without offsetting cuts.  KASB has PDF copies of the spreadsheets, but does not have actual spreadsheet files for calculations.  The Kansas State Department of Education does not plan to post spreadsheets until proposals are in bill form.

It should be stressed that all of these proposals are simply concepts and likely to change.  However, it is important to understand each of these concepts individually and how they work together. Here are some key points to remember.

  • First, the $105 million identified by the courts to address inequities in the local option budget would primarily go to “equalize” property taxes.  It would not provide ANY new spending authority.  For districts that are effectively capped at the maximum LOB, increased state would simply reduce their mill levies.  Because lower wealth districts get the most state aid, they would have the biggest decrease in mill levies.  On the other hand, the wealthiest districts would receive no additional aid.

  • Second, the $25 million capital outlay state aid would provide more spending power to districts that receive it, but can only be used for long term capital costs, not regular operating budgets.  Again, a number of higher wealth districts would not receive any of these funds.

  • Third, to reduce the cost to the state, both Senate Republicans plans (and to a lesser extent, the House Republican plan in HB 2774) cut other parts of the school district funding formula.  These means districts would lose actual operating funds.  Statewide, the Republican Leadership plan would cut operating budgets by about $36 million.

  • Fourth, these targeted cuts have very different impacts.  For example, reducing the transportation weighting (in all three plans) affects every district, but some districts transport a higher percentage of their students and would likely have a higher reduction.  Other weightings apply only to certain districts.

  • Fifth, the Senate plans - unlike the House proposal - would allow districts to increase their Local Option Budget from the current maximum of 31 to 33 percent, with an election required for percentages over 30 or 31 percent.  (An explanation memo says 31 percent, but staff sources understood the proposal to be the current threshold of 30 percent.) The Senate documents say that proposal would allow districts increase LOB authority statewide by almost $85 million.

  • Sixth, most local boards are concerned about raising their LOB because it has required a mill levy increase, which would be unpopular with voters.  However, in many districts, the amount of LOB state aid required by the Gannon decision appears to be more than the cost of increasing the LOB to 33 percent.  In other words, they could raise their LOB to cover losses in the general operating funds WITHOUT increasing the mill levy, but their taxpayers would have a smaller mill levy reduction.  On the other hand, districts that receive little or no state aid might have to raise their LOB percentage AND mill levy to make up for the loss in weightings.

The result is that both Republican plans would potentially provide additional operating funds on a statewide basis, unlike the current House plan or Democratic proposals to simply fund LOB and Capital Outlay state aid.   However, the actual impact on each individual district varies dramatically.  It’s critical for school leaders to work with their Legislators to determine the impact of each component, as well as the total net impact.  Finally, depending on any election threshold, it would be up to local board and/or voters to actually use the increased operating authority.

Now, let’s look at the specific components of each plan.  It should be stressed these are not actual bills, and are highly subject to change.

Senate Leadership proposal:

Fully fund Local Option Budget state aid.  Requires an estimated $103.9 million next year, up from $94.5 million in the current year.  The approximately 19% of districts with the highest assessed valuation per pupil do not receive LOB aid.  The remaining 81% quality for aid. As a district’s valuation per pupil declines, it received a higher percentage of aid for its LOB, which reduces the required mill levy for its LOB.  Because state aid has not been fully funding, these districts have had to either raise their mill levy or reduce the LOB.

Fully fund Capital Outlay state aid. Requires an estimated $25.2 million.  There is a similar formula for capital outlay aid, which is used match or supplement a local capital outlay levy.  Capital outlay aid has not been funded since 2010.  Only about half of districts would receive aid, either because they are high in valuation per pupil, or because they do not have a capital outlay levy.  Capital outlay cannot be used for regular operating expenditures. However, under a law passed last year, if the aid formula is fully funded, districts can use these funds for some additional purposes, such as performance uniforms and software.  Districts would have to adopt a new capital outlay resolution, subject to protest petition, to spend on these additional purposes.

Count an increase of $14 in base state aid per pupil.  Raising the base from $3,838 to $3,852 is already included in the Governor’s budget.  This will provide districts an estimated $9.6 million.

Reduce virtual school funding by over 50 percent.  This would save the state - and cost school districts - $14.4 million.  The proposal would fund students in virtual schools at 50 percent of the base budget per pupil, with no additional weightings.  Currently, students in virtual programs are funded at 105 percent of the base state aid per pupil.  This would reduce funding in over 80 districts.

Eliminate at-risk non-proficient weighting.  This would save the state - and reduce total district funding - by $4.9 million.  Non-proficient weighting is based on students who score below proficient on state reading or math tests and are NOT eligible for free meals.  (The number of students receiving free meals determines the district’s “regular” at-risk weighting.)  The weighting was designed to allow districts with very low free lunch rates to receive funding for programs assisting students who are at-risk of academic failure.  Every districts receive some funding under this weighting - and would lose by its elimination.

Reduce transportation weighting by $16.5 million.  This proposal (the same as in HB 2774) which would adopt a different formula developed by the Legislative Post Audit Division in the 2006 school district cost study.  It would reduce transportation funding for every district, and cut total transportation aid by about 16 percent.  It would reduce transportation aid for every district.

Reduce high density at-risk weighting by $7.2 million.  Approximately half of school districts would have funding reduced by this cut.  It appears the reduction would be based on a change in the “linear transition” so districts with the least density of low income students would receive the highest percentage cut.  Total high density at-risk funding is $52 million, so this would be a 14 percent reduction statewide.

Reduce eligibility for at-risk weighting by $3.5 million.  The proposal would disallow the counting of any students over 19 years old for at-risk weighting, which is contained in HB 2774, and would also disallow counting part-time students (other than kindergarten) for at-risk weighting.  KASB does not have information on who many districts this would affect.

Phase-out new facilities weighting.  The proposal would allow facilities in their second year of operation to receive this weighting, but no new facilities would be eligible next year, reducing the expected cost in 2014-15 by $10 million.  Approximately 35 districts received $13.7 million in new facilities weighting this year.

Increase the maximum Local Option Budget from 31 percent to 33 percent, with anything above 31 percent requiring an election.  Under current law, districts are required to hold an election to adopt an LOB over 30 percent of the general fund, and the maximum percentage is 31 percent.  Presumably, this proposal would allow districts at 30 percent or below to increase to 31 percent without an election, and those districts at 31 percent or below to increase up to 33 percent, if approved at an election.  However, Legislature staff indicate that the intention may have been to keep the election for LOB amounts over 30 percent.

In order to hold an election in time to authorize a higher LOB for next school year, the election would probably have to be held no later than the August primary election.  The Secretary of State’s office indicates school boards would need to notify their county election officials by the first of June.  This issue will become difficult of a bill does not pass in time to take effect prior to that date.

The plan appears to assume the amount of LOB state aid required to fully fund equalization for the additional LOB authority next year is $5 million.

The net result is that the $129 million cost of LOB and Capital Outlay next year would be reduced by $14.4 million in virtual weighting, $4.9 million in non-proficient weighting, $16.5 million in transportation weighting, $7.2 million in high density at-risk weighting, $3.5 million in at-risk weighting by not counting students 19 and older and part-time students, $10 million for new facilities weighting; and adding $5 million for increased LOB equalization due to raising the LOB maximum from 31 percent to 33 percent.  This leaves a “net” cost to the state of $77.6 million, rather than nearly $130 million.

However, the LOB spending “authority” would also increase, by about $85 million statewide.  The more districts actually used this additional LOB authority, the greater the cost of LOB equalization.  Remember, the actual impact on individual districts varies.

Senator Masterson proposal (same leadership plan with the following exceptions):

Increase base state aid per pupil $65, rather than $14, and further increase the base $450 to include funding for KPERS.  This would provide a total increase of $515 dollars to the base, at a statewide cost of $352.3 million.  Most of this would be from dividing total current state KPERS contributions for school employees by weighted enrollment and adding that amount to the base.

Require districts to pay the actual cost of the employers KPERS contribution on behalf of their employees.  This would cost districts a total of $307.5 million next year.  This means every district would receive the same amount for each weighted student in the base, but would have different costs depending on what they pay their employees.  Because the KPERS cost is based on a percentage of payroll, districts with higher employee costs would have to spend more than they received in base aid, while districts with lower costs would spend less on KPERS than they received in base aid.  In addition, because the base is increased goes to weighted enrollment, districts with more weighted students receive more.

It should be noted the KPERS contribution rate is expected to increase significantly over the next several years.  Under current law, the state is responsible for paying that increase.  Under the new proposal, if the base did not increase at least as fast as the KPERS rate, districts would have to reduce other expenditures to pay for KPERS.

Reduce regular at-risk weighting by 10 percent.  This would save the state - and reduce district funding by - $34.5 million.  It would impact every district.

Reduce high density at-risk weighting by $36.7 million, rather than $7.2 million.  This would reduce high-density at-risk funds by over 70 percent.

Provide $14 million statewide for transition funding.  This is described as a one-year “hold harmless” provision that would keep any district from a net loss in state aid.

Impact on your district:

To calculate the impact of these changes for  your district, you need to review the proposed spreadsheets (or other proposals).

First, determine any proposed additions to your general fund through the base budget.

Second, subtract the reductions in weightings and other costs, such as KPERS payments in the Masterson plan.  The result is the net change in your general fund budget.

Third, estimate the impact of fully funded LOB state aid on your LOB mill levy (if any).

Fourth, determine how much of an increase in your LOB would be needed to offset reductions in your general fund, and any additional increase up to 33%.

Fifth, determine what mill levy would be necessary to provide that amount.

Sixth, compare the net increase or decrease in LOB mill levy.

Seventh, determine if any capital outlay state aid received could be used to reduce the capital outlay levy, or reduce transfers that would free up additional dollars in your general fund.

This is obviously a constantly changing situation.  We will continue to update school finance proposals as we learn more, and as new plans are presented.

Tuesday, March 25, 2014

Analysis of New House School Finance and Policy Bill

Analysis of HB 2774 - Financing of Kansas Public schools


Introduced March 24.  Referred to House Appropriations Committee.  Major subject areas:


1.  Counting all funding provided or authorized toward suitable financing.


New Section 1.  Declares legislative intent is to provide for a financing system which provides students with the capacities set forth in section 3, and that such financing includes all revenues from state and federal programs provided to school districts or otherwise supporting educational needs of public school students.  Specifically includes:


(a) federal funding to unified school districts or public schools,


(b) appropriations of state moneys for the improvement of public schools, including, but not limited to:
  • the school district finance formula;
  • employer contributions to the Kansas public employees retirement system for public schools;
  • appropriations to the Kansas children's cabinet for programs which assist students enrolled in USD with their educational needs;
  • transportation financing;
  • financing to other facilities which provides public education to students, such as the Kansas state schools for the blind and deaf, school district juvenile detention facilities and Flint Hills job corps center;
  • Kansas academy of mathematics and science;
  • teacher awards and professional development;
  • appropriations to the state board of regents to provide technical education incentives to USDs and tuition costs for career technical education to secondary students; and
  • appropriations to any postsecondary educational institution which provides postsecondary education to a secondary student without charging tuition to such student (dual enrollment); and


(c) any provision local tax authority for the financing of public schools.


2.  Constitutional standards for education goals


New Section 2.  Establishes goals of the state education system based on the “Rose” standards that the Kansas Supreme Court ruled in Gannon are the constitutional basis for determining the adequate level of K-12 funding. (The Rose standards are named for a 1989 Kentucky Supreme Court decision.)


The goal is to provide each and every child with at least the following capacities:
(1) Sufficient oral and written communication skills to enable students to function in a complex and rapidly changing civilization;
(2) sufficient knowledge of economic, social, and political systems to enable the student to make informed choices;
(3) sufficient understanding of governmental processes to enable the student to understand the issues that affect his or her community, state, and nation;
(4) sufficient self-knowledge and knowledge of his or her mental and physical wellness;
(5) sufficient grounding in the arts to enable each student to appreciate his or her cultural and historical heritage;
(6) sufficient training or preparation for advanced training in either academic or vocational fields so as to enable each child to choose and pursue life work intelligently; and
(7) sufficient levels of academic or vocational skills to enable public school students to compete favorably with their counterparts in surrounding states, in academics or in the job market.


3.  Counting state funding for required courses


New Section 3.  In any school finance legal challenge, all state moneys appropriated, distributed or otherwise provided by the state to school districts is to be deemed by the court to have been first applied to pay the costs of required areas of instruction under state law, including the Rose capacities, and for the courses included in the pre-college curriculum prescribed by the State Board of Regents.


4.  Full funding of Local Option Budget state aid and Capital Outlay state aid


New Sections 4.  Appropriates an additional $103,865,000 for local option budget state aid next year (FY 2015) in compliance with the Gannon school finance decision.


New Section 5.  Amends capital outlay state aid statute to allow transfers to be made from the state general fund next year (FY 2015) in compliance with the Gannon decision.


5.  K-12 Student Performance Commission


New Section 6.   Creates an 11-member K-12 Student Performance Commission to study and analyze article 6 of the constitution of the state of Kansas, and make recommendations to the legislature regarding the educational needs of children in Kansas.


The commission shall particularly study and review the following areas:
(1) the “Rose” capacities set forth in section 2;
(2) measures of student performance, such as statewide assessments, standardized tests used in college admissions, graduation rates and any other measurements used to assess student performance and growth; and
(3) public school accreditation requirements in light of the “Rose” capacities.


(The focus of this committee is significantly different than the one proposed in the earlier school finance bill, HB 2773, which focused more on operational efficiencies.)


The commission will have 11 members: 2 appointed by the President of the Senate, 1 appointed by the Senate minority leader, 2 appointed by the Speaker of the House of Representatives and one shall be appointed by the House minority leader, 3  appointed by the governor.  The Commissioner of Education, the Director of the Budget, the Revisor of Statutes and the Director of Legislative Research shall be nonvoting, ex-officio members of the commission, which shall submit a report to the Legislature before January 9, 2015, with findings and recommendations.


6.  Alternative licensure for high school CTE and STEM teachers


New Section 7.  Creates an alternative teacher licensure system for secondary teachers, who may be hired by a local board without completing a teacher preparation program if:
(1) The applicant holds a valid teaching license from another jurisdiction and has obtained the required scores on the Praxis series test, or
(2) the applicant has an industry-recognized certificate in a technical profession; at least five years of work experience in such technical profession; and a job offer to teach a career technical education course related to such technical profession; or
(3) the applicant has at least a bachelor's degree in the subject matter area of science, technology, engineering, mathematics, finance or accounting; at least five years of work experience in such area; and a job offer to teach in such area.


7.  Teachers under tort claims act


New Section 8. Requires each school district to provide written notice to each teacher employed by such district of protections afforded teachers under the Kansas tort claims act, which provides liability protection to teachers as public employees.


Specifically, the notice must  include information about a teacher's coverage as an employee of the district, the amount of liability coverage provided and the procedure in which to request a defense under act.


Section 20.  Specifically adds reference to teachers as included in coverage under the tort claims act. Presumably, this is to allow teachers to have legal protection without having to purchase liability insurance from other providers.


8.  Expansion of Innovative School Districts


Section 9.  Expands the maximum number of innovative school districts from the current 10% of unified school districts in certain circumstances.  An amount in excess of 10% but not to exceed 20% of school districts in the state may operate as public innovative districts if such
school district operates a school within its district which is deemed to be either a Title I focus school or a Title I priority school as under the Elementary and Secondary Education Act (No Child Left Behind) flexibility waiver.  Any request for approval under this exemption must be reviewed by the coalition board for approval.


9.  Changes in school finance terminology: local effort and statewide mill levy


Sections 10, 12, 15-17.  In the school finance act, renames “local effort” as “school financing sources,” and the 20 mill statewide levy as the “public school financing levy.”


10.  Reduces transportation weighting based on Legislative Post Audit study


Section 13.  Amends the transportation weighting formula, based on the recommendations of the 2006 Legislative Post Audit cost study which said the current formula overstates costs that should be be paid for transporting students who live more than 2.5 miles from school.  (KASB has not been able to confirm the fiscal impact of this change.)


11.  Excludes free lunch students over age 19 from at-risk weighting count


Sections 11,14.  Amends the school finance law to exclude students older than 19 from the count of at-risk weighting.  This estimated to reduce at-risk funding by less than $3 million.


12. Statutory Base State Aid Per Pupil


Section. 11.  Removes a statutory amount of base state aid per per pupil, currently $4,492.  Instead, the base would be determined by the amount actually appropriated each fiscal year for the designated school year (which is, in fact, what happens now: the actual base is determined by the appropriation).  The appropriated amount shall be based on considerations of funding from all available resources, including the amount of funding described in section 1 (which references all sources of revenue to school districts).


13. Extension of Capital Outlay


Section 18.  Amends procedures for school districts to renew a capital outlay levy prior to the expiration of the current resolution.  (KASB is researching the impact of this provision.)


14.  School Budget Documents

Section 19.  Amends the  Kansas uniform financial accounting and reporting act for school districts to require “one page” budget summaries and budgets at a glance, and requires that publications required by this subsection shall be made available to the public at every meeting held by the board of education of each school district when the board is discussing the district's budget or any other school finance matters.

Monday, February 17, 2014

Are Charter Schools the Answer to Education's 911 Call?

At last Friday's hearing on a bill to dramatically expand authority to approve and operate public charter schools in Kansas, one of the proponents offered a striking image: many public school students, especially from low income families and minority groups, are facing an educational emergency. The answer to that 911 call for educational help, said proponents of SB 196, is expanded school choice; specifically allowing entities other than public school boards to approve and operate publicly-funded schools.

Let's agree at the start that too many students do not reach the educational levels they will need to be successful, and that despite progress - which this blog has celebrated in the past - Kansas and the nation still have a large "achievement gap" in educational outcomes. If charter schools can be shown to help close that gap, it would be a powerful argument in favor of changing Kansas law. States have been experimenting with charter school laws for 20 years, and charter school enrollment has increased dramatically. What does the record really show?

The research is, at best, mixed on the impact of charter schools on students when comparing charter schools to traditional public schools.  I wanted to look at the impact of charter schools on the education achievement of the state as a whole; in other words, state to state comparisons. To do so, I considered KASB's research on state educational achievement, all based on readily accessible national reports.

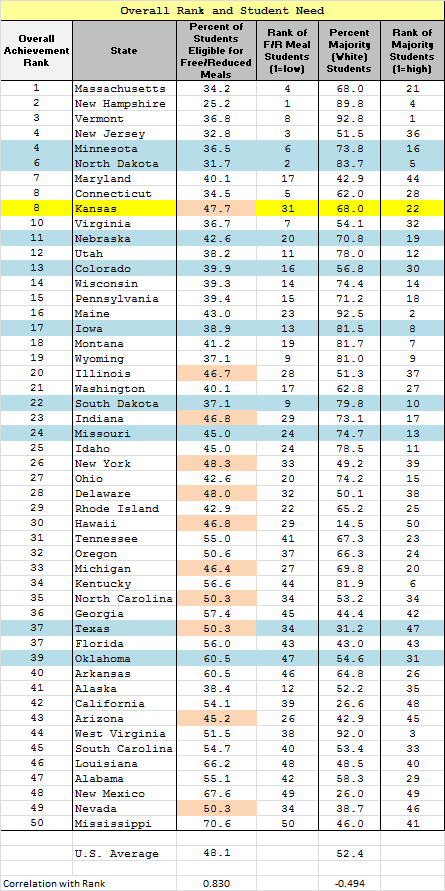
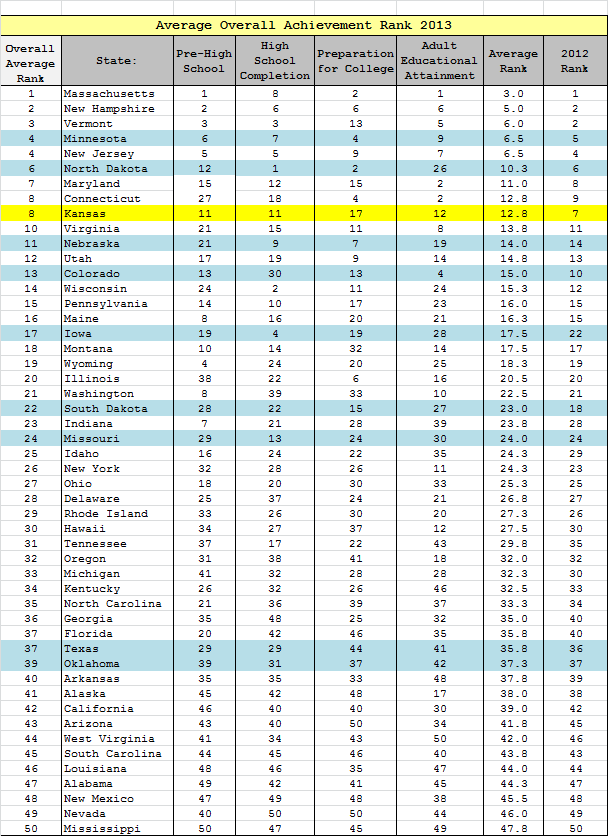
The first chart below provides overall national ranks of achievement in four areas: pre-school tests (the National Assessment of Educational Progress), high school completion, preparation for college and adult educational attainment.  Across all four of these categories Kansas is tied for 8th in the nation. So we should start by pointing out that under our state's current charter school law, Kansas has higher performance than 80% of the other states, including many with more liberal charter school policies.


However, states vary significantly in the student populations they have to educate. The next chart shows the percent of low income students (those eligible for free or reduced lunch) for each state, as well as the percent of majority (white) students.  There is a very high correlation (0.83) between a high educational achievement rank and a lower percentage of low income students. That means the more low income students in a state, the lower that state's achievement tends to be.

If you aren't familiar with statistical correlation, remember that 1.0 is the highest possible correlation; it essentially means a "one to one" correspondence between two variables. For example, New Hampshire has the lowest percent of free/reduced eligible students in the nation and ranks second in achievement; Mississippi has the highest low income population and the lowest achievement. Note also that ethnicity, although significant, has a considerably weaker correlation with achievement rank than income (0.49). That is not really surprising: economically advantaged minority students usually perform as well as majority students from similar income levels, and low income white students struggle academically.


Kansas is just below the national average in low income students and ranks 31st, which means Kansas would be expected to rank in the lower middle of states in achievement. However, Kansas' achievement rank is 8th, which means Kansas “over-achieves” its income position by 23 positions.  Florida, often mentioned as a high achieving state despite its poverty, ranks 43rd in income and 37th in achievement - “over-achieving” by five positions.

I have also highlighted the 10 states closest to Kansas in percentage of low income students.  Only two rank in the top 25 on achievement; Illinois at 20th and Indiana at 23rd.  Note that Arizona, which has a slightly lower percent of low income students than Kansas, ranks 26th in low income students but 43rd in achievement.


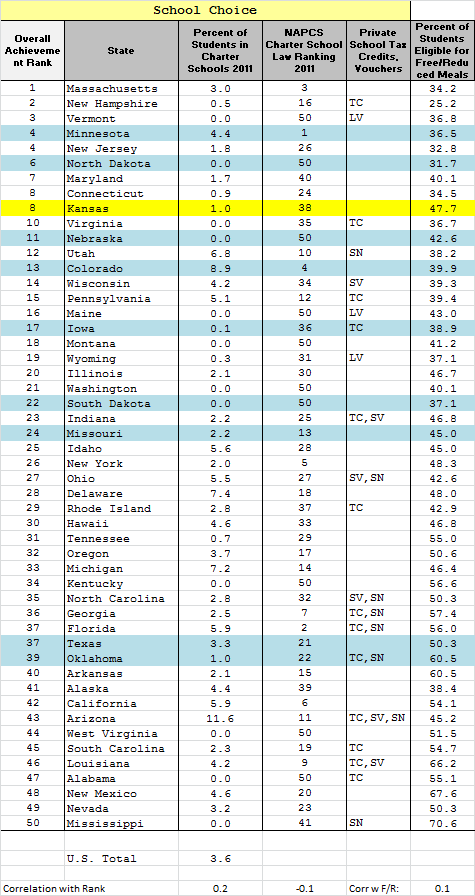
The next chart provides three columns of information on school choice.  The first column shows the percentage of students in charter schools in 2011 as reported by the federal government.  The second column has a ranking of state charter school laws by the National Association of Public Charter Schools, an organization that supports expansion of charter schools and multiple "authorizors" as proposed in SB 196.  Note that Kansas’ law is ranked 38th - which means we have what is considered a weak charter school law - but Kansas still ranks high in achievement, even after adjusting for student income.  (KASB ranks all states without charter schools as 50th.)  The third column indicates whether the state has tuition tax credits or other funding for private schools.

Note there is an almost insignificant 0.2 positive correlation between the percent of students in charter schools and achievement rank, and an even more insignificant negative correlation with a high charter school law ranking. In other words, charter schools make almost no statistical difference in state achievement.  Also, there is no statistical correlations between the percent of students in charter schools and the percent eligible for free lunch. This means charter enrollment is not disproportionately grouped in higher or lower income states.


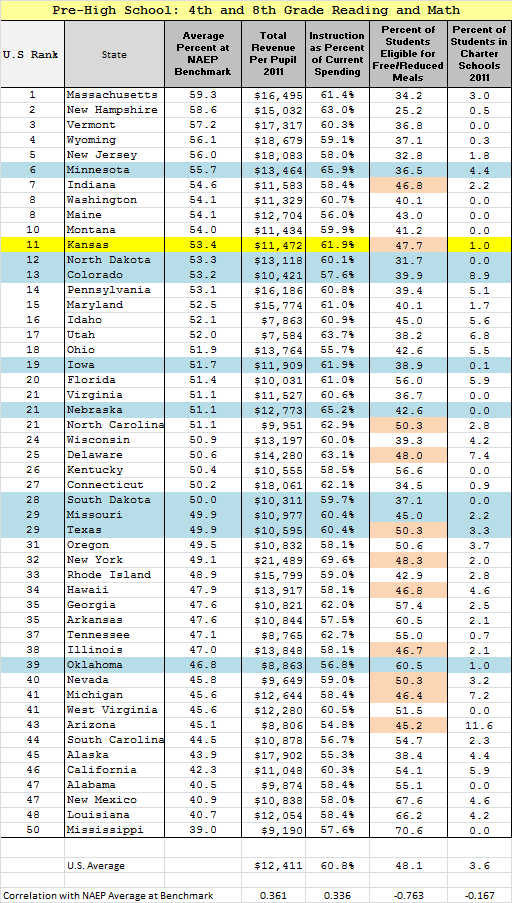
The next table ranks states by an average of four National Assessment of Educational Process benchmarks: the percent of all students scoring at the basic level and at the proficient level, and the percent of low income students at basic and at proficient.  Note Kansas ranks 11th.  Of the 10 states ranking higher than Kansas, six had a lower percentage of charter school enrollment than Kansas, and five had a higher percentage.

Each of the ten states with a low income student percentage closest to Kansas (in pink) had a higher percentage of students in charter school. Yet Kansas ranked higher than every state with similar low income enrollment except Indiana - which spent more per pupil and had slightly fewer low income students.

There is an insignificant, but negative, correlation between charter school enrollment and NAEP scores, which essentially means that having more students in charter schools makes no difference in fourth and eighth grade reading and math. Note that Michigan and Arizona, two of the highest charter school enrollment states, are both similar to Kansas for low income students, but score in the bottom 10 states.


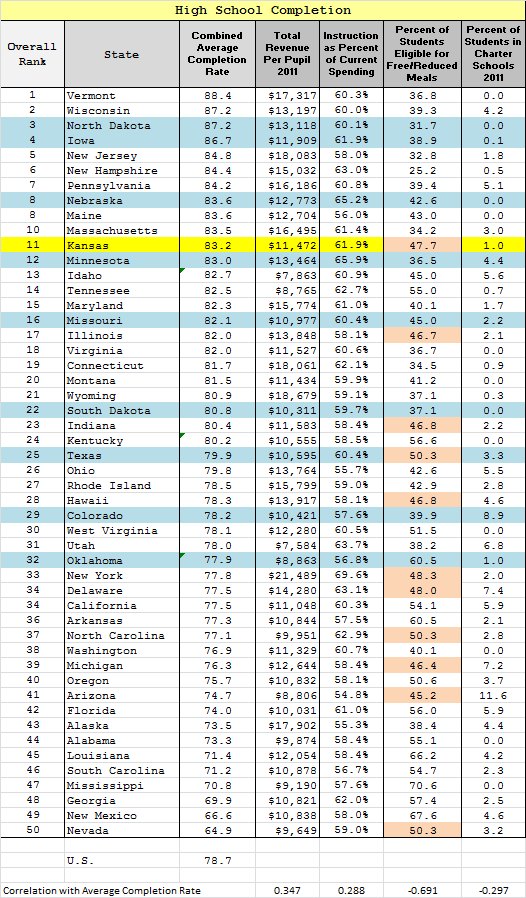
NAEP tests only provide achievement data up to grade eight. The next chart ranks states by an average of four different graduation rates from national reports.  As with NAEP scores, Kansas ranks 11th in the nation.  Of higher ranking states, six had fewer charter school students than Kansas.  Kansas had higher achievement than every other similar states based on low income students, although every other similar state had higher charter school enrollment.

The table also shows that some states with high NAEP scores fare much worse in actually graduating students. For example, Indiana ranks 7th in NAEP scores, but falls to 23rd in graduation; Colorado drops from 13th on NAEP to 29th in graduation, and Florida drops from 20th in NAEP to 42nd in graduation. Note that there is 0.29 negative correlation between the percent of students in charter school and the average completion rate.


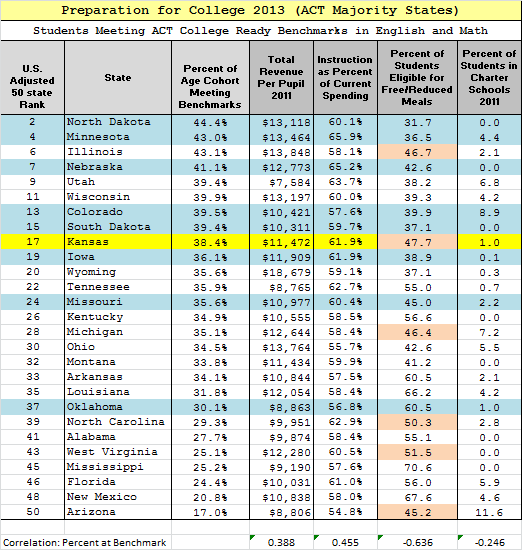
The next chart shows the states where most students take the ACT test for college, including Kansas.  We use a formula to adjust the percent of students who meet college ready benchmarks in reading and math by the percent of students tested and the graduation rate.  Kansas ranks 9th, which would be an adjusted rank of 17th if applied to all 50 states.  Five of the eight higher-performing states had more students in charter schools, but every higher achieving state spent more per pupil.

Again, there is a modest negative correlation between charter school enrollment and the percent of students meeting college-ready benchmarks, which means states with more students in charter schools are somewhat less likely to have higher achievement. Note that Florida ranks third from the bottom, and Arizona, the state with a higher percentage of students in charter schools, ranked last. On the other hand, some high achieving states like Minnesota, Utah and Colorado have a high percentage of students in charter schools, but also have a much lower percentage of low income students.


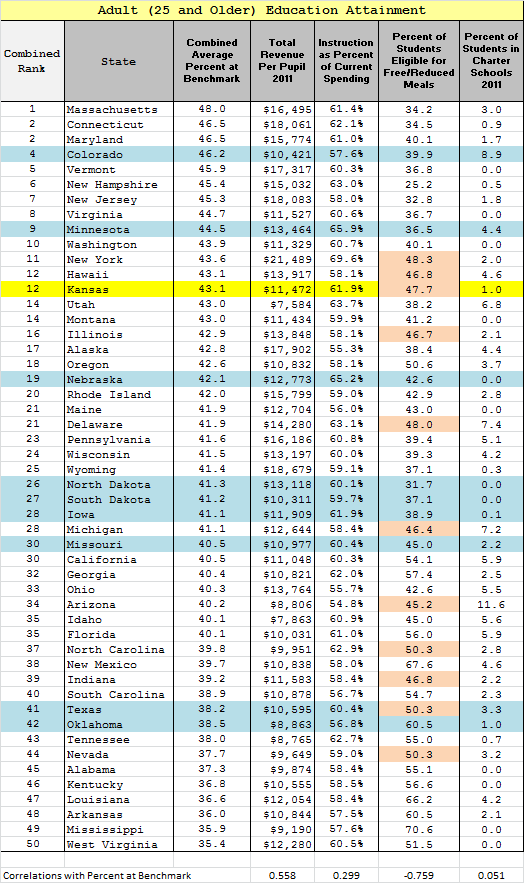
The final chart ranks states by a combined average of the percentage of adults 25 and older who have completed high school, completed a four year degree, and completed an advance degree.  Kansas is tied for 12th.  Of the 11 higher performing states, five have lower charter school enrollment, and every higher achieving state had at lower percentage of low income students than Kansas except New York.


This data is very clear. First, Kansas is already a high achieving state, despite having more low income students than most states. Second, statistically having more students in charter schools makes no difference in achievement, and in some cases has a modest negative correlation. Third, Kansas already does better in achievement in almost every case than similar states, regardless of charter school enrollment.

What the data shows is that states with fewer low income students tend to have higher achievement, regardless of charter school enrollment. On the other hand, high charter school enrollment doesn't help states with higher poverty do better. In other words, charter schools haven't solved the 911 emergency of student achievement.

What does help boost achievement? We also provide the total revenue per pupil for each state. In every case, total revenue per pupil has a statistically stronger correlation with achievement than charter school enrollment.

Let’s be clear: we can’t be satisfied with Kansas outcomes.  We need to be truthful about the number of Kansas students who are not achieving at satisfactory levels.  But we also need to be truthful about the equal or greater achievement problems in high charter school states.  Expanding charter schools has not proven to be the answer.