Friday, August 21, 2015

Questions on K-12 School Funding

A number of state leaders and organizations are beginning to look seriously at the development of a new school finance system to replace the law abolished by the 2015 Legislature and the two-year block grant system adopted in its place. Here are some basic questions about school funding in Kansas and information to help answer them.

  • What is the right balance of state, local and federal revenues and the right balance of sales, income and property taxes?

In Kansas, as in most states, public schools rely on a mix of state, local and federal revenue. Nationally, federal funding provides about 9 percent of school district revenues, with the balance split almost equally between state sources (45.6 percent) and local sources (45.3 percent), according to the U.S. Census Bureau’s Public Education Finances Report.


Kansas is much higher in state funding (56.4 percent) and lower in local funding (36.2 percent), and is also below the national average in federal funding (7.4 percent). The higher share of state funding was a deliberate choice in 1992 when the now-repealed school finance formula was adopted. The goal was to both increase school funding and reduce local property taxes, as well as narrow the range of property tax rates for school districts. At the time, general operating levies ranged from under 10 mills to over 100 mills.


Although Kansas ranks relatively high in the level of funding provided by the state, it remains below average in total dollars per pupil because local and federal revenues are so low. In 2013, Kansas funding from the state ranked 19th at $6,537, but ranked 32nd in local revenues at $4,198, and 45th in federal revenues at $861. Overall, Kansas ranked 27th in total revenues per pupil at $11,596. Kansas per pupil funding has generally been about 5 percent below the national average for the past 20 years.


Both Kansas’ funding rank and the share of funding from state sources will be much more difficult to maintain if the state continues to phase-out the individual income tax, which has been integral to those positions. According to the 2014 edition of Kansas Tax Facts, the state currently receives approximately 40 percent of state general fund revenue and 30 percent of all state revenue from the individual income tax. Most (but not all) state aid to K-12 education comes from the state general fund, which indicates that over 20 percent of current school funding can be attributed to the individual income tax.


Income, sales and property taxes are the only major revenue sources currently available in Kansas, accounting for over 83 percent of total revenue to state and local governments. Most of the rest are taxes on motor fuels, vehicles and unemployment compensation that could not be used for K-12 education.


As a result, eliminating the income tax over time means the state must either rely more heavily on sales and/or property taxes, or reduce either the amount of school spending or the rate of increase compared to other states and past performance in Kansas.


  • What is the role of local funding for Kansas school districts, such as the Local Option Budget?


The original proposal for the 1992 school finance formula called for a complete state takeover of school funding in Kansas (except local school building costs) and included a local option budget only as a temporary “hold harmless” feature, or to finance local “extras.”


However, Local Option Budgets grew from less than 4 percent of total district budgets in 1993 to over 17 percent in 2015 for two major reasons. In the late 1990s, the Legislature cut the statewide mill levy from 35 to 20 mills and took it off automobiles, and replaced those funds with state aid. That meant state aid was increasing, but was largely offset by reduced property taxes. As a result, school district general fund budgets per pupil increased less than inflation in nine of the twelve years between 1993 and 2005.


After the Montoy school finance decision in 2005, the Legislature increased K-12 funding significantly, but most of that money was targeted for specific programs, such as special education, at-risk and bilingual services, that were the basis of the lawsuit. These dollars did not go into general funding for all students.


Because most general state aid went to tax cuts or targeted programs, districts had to increasingly use the Local Option Budget to cover the costs of “regular” education programs which increased due to inflation, to keep salaries competitive with the private sector, or to improve programs.


  • What is the role of technical schools and community colleges?


Projections show the percentage of Kansas jobs requiring postsecondary education will continue to increase. The Kansas Board of Regents set a goal of increasing the state percentage of adults with a technical credential or an academic degree to 60 percent by 2020. Recent incentives for boosting the number of students earning credentials at technical and community colleges have been successful.


More students in technical and community colleges will increase cost. The only alternative to local funding is either increased state aid, which will have to compete with tax cuts or K-12 funding, or increased tuition, which will place a larger burden on lower income students who may have to rely on these programs for access to any postsecondary education.


  • What special funding or weightings should be included in the funding formula?


Transportation, special education, language services have long been funded as separate programs or weightings, because they are required at least in part by state or federal law. The largest weighting used in the previous formula was based on students eligible for free meals, because studies show lower income students consistently start school academically behind their more advantaged peers and frequently fail to catch up without special assistance. The previous formula also provided additional funding for smaller districts on a scale that increased as enrollment decreased.


The cost of each of these programs differs substantially among districts because of different student populations. Without weightings or some other way to target extra resources, children in districts with sparse student populations, or with high concentrations of students with disabilities or requiring English language instruction or low income families, will be disadvantaged. They will have to spend less on “regular” education programs and will be unlikely to help all students successfully prepare for college or careers.


In fact, what some call “failing schools” usually differ only in that they have many more special needs students than what are viewed as successful schools.


  • Should a new formula consider changes in the organizational structure of school districts?


These questions raises the issue of school district consolidation, or at least changes in how districts cooperate with each other in certain operations.


According the Digest of Education Statistics, Kansas ranks near the bottom of states in students per district (41st), students per school (40th) and students per school district staff (39th). In other words, Kansas is notable for small districts and small schools (in terms of students), small classes sizes and more teachers and other district employees. Kansas also allows school districts to pick and choose services from multiple service centers and cooperatives, unlike some states which set up regional service providers.


To some, this may sound highly inefficient. But while Kansas is on the low end of the scale for organizational size and staffing per pupil, it is on the high end for student achievement, ranking 5th in the nation on an average of 14 measures of student achievement. (See KASB Research for information on these measures.) At the same time, Kansas spends less than the national average. No other top 10 states spends less than Kansas, and no top ten states has fewer low income, harder-to-educate students. This indicates that Kansas is actually quite efficient, and certainly is doing something “right.”


Consider an alternative perspective. Small districts in Kansas keep schools tied to their communities. Small schools keep students from getting lost in the crowd. Small classes give students more individual attention from teachers. More teachers and other staff mean there are more caring adults in the lives of students, from the teacher to the bus driver, the lunchroom staff, and the coach.

Virtually every school district already participates in various cooperative services, but leaving the decision at the local level means private sector vendors of goods and services compete for school district business based on both price and service.


In fact, these are exactly the arguments used to call for charter schools and private schools in other states: to create smaller, more independent schools in place of larger, less responsive bureaucracies. Perhaps Kansas already has what some reformers say public education needs.


  • How should a new formula account for student success?


The most important question to ask about any educational policy is this: based on the evidence, what will help more Kansas students leave school prepared for success as adults? Kansas already ranks very high in measures of student success, yet spends below the U.S. average.To improve results, state policies must first avoid doing harm to what is working well.

Thursday, August 20, 2015

Calculating dollars for instruction

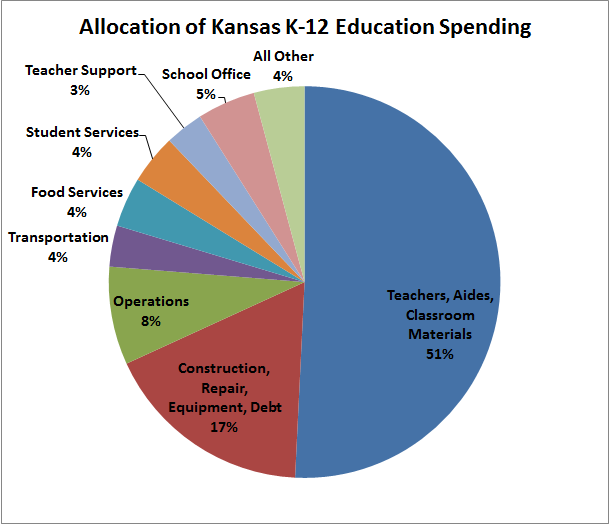
A school superintendent recently asked the source of information used to calculate this pie chart from the August 12 Tallman Education Report entitled Kansas School Districts and Funding for Instruction:


The district was interested in doing a similar study of its own expenditures. Here is where to find the data and how to compute it.

First, the Kansas State Department of Education website provides a report for the state as a whole and each school district with the amount of total “current” expenditures, and expenditures for each major budget function: instruction, student support, instructional support, etc. This link takes you to the current operating expenditures page, where you can find a report for the state and for each district, as well as differences and definitions.

These reports also show the percent of current expenditures in each area. Statewide, the area of instruction received 61.44 percent of current expenditures in 2013-14, 3.5 percent below the “state policy goal” of 65 percent.

However, “current” expenditures does not include long-term “capital” costs, such as equipment, capital outlay and construction costs funded by bond and interest payments. To determine this amount, KASB used another KSDE report on total expenditures for the entire state and for individual districts, available at this link.

KASB subtracted the statewide current spending total of $4.938 billion from the overall total of $5.975 billion, which leaves capital expenditures and debt service of $1.083 billion. KASB then divided that amount, along with all other totals from the first report on current spending, by the overall total. Using this calculation, instructional spending drops to 50.8 percent.


Total
Per Pupil
Per 20 Pupils
Percent of Total
Total Spending
$5,975,518,000
$12,960
$259,192

- Current Spending
$4,937,722,062
$10,709
$214,177

= Capital, Debt
$1,037,795,938
$2,251
$45,015
17.4%
Current Spending =


Instruction
$3,033,444,556
$6,579
$131,578
50.8%
+ Student Support
$247,849,898
$538
$10,751
4.1%
+ Teacher Support
$193,651,234
$420
$8,400
3.2%
+ General Administration
$117,787,173
$255
$5,109
2.0%
+ School Administration
$286,071,070
$620
$12,409
4.8%
+ Operations & Maintenance
$486,116,525
$1,054
$21,086
8.1%
+ Transportation
$202,860,444
$440
$8,799
3.4%
+ Other Support
$123,133,506
$267
$5,341
2.1%
+ Food Services
$242,419,883
$526
$10,515
4.1%
+ Adult & Community Service
$4,387,773
$10
$190
0.1%


100.0%

If you haven’t read it, the previous blog argues the 65 percent policy goal is unclear, unrelated to either student success or levels of spending, and unresponsive to important differences among districts.

The table above also divides the statewide totals by statewide enrollment to provide a per pupil amount, and multiplies that amount by 20 to provide an average for a classroom of 20 students.

What does this mean? KSDE already reports the amount and percentage of expenditures on instruction and other budget areas for current expenditures. KASB’s procedure can be used to calculate the amount and percentages for total expenditures for any district.

It is important understand why there may be significant differences in these percentages among districts. Districts with bond issues or major equipment purchases will be higher in capital costs. Districts that bus more students will be higher in transportation. Districts will more school buildings will have higher school administration costs, and perhaps higher operations and maintenance expenses.

Note that for purposes of the chart, KASB combined general administration, other support services and adult and community services into one area. Here is a quick link to the definitions of each budget area. Here is a link to the Kansas School District Accounting Handbook.

KASB has also prepared an online, interactive tool that shows total employees statewide and for each district, arranged by the same budget areas, going back to 1998. This report shows the number of staff positions in each budget area, as opposed to the total dollars spent in each budget area. For questions, contact KASB Research Specialist Ted Carter at tcarter@kasb.org.

Wednesday, August 12, 2015

Kansas School Districts and Funding for Instruction

Looking only at how much money school districts spend on instruction is like comparing baseball teams based on batting average, rather than wins and losses. It is an indicator, but it doesn’t guarantee results.


Spending on instruction doesn’t tell how successful a district or state is at educating students. Just as pitching, defense, and strategy also contribute to team’s performance on the field, other areas of school spending have big influence on student success.


And by most measurements, Kansas schools are succeeding.


Using 14 measures of student achievement and attainment, Kansas leads 44 states on a majority of those indicators. Of the five state with higher results than Kansas, all five have significantly higher funding per pupil. In addition, of those five, three spent a higher percentage of their total funding on instruction and two spent less.


On the other hand, 18 states spent a higher percentage of total funding on instruction, and have lower achievement than Kansas. The remaining 26 states had both a lower percentage spent on instruction and lower achievement.


It is clear that simply shifting more money to instructional spending will not guarantee improved student success.


The issue arose again recently when Governor Sam Brownback urged school districts to shift more funding to “the classroom” and said most districts are not complying with state law.


Contrary to some claims, there is no legal requirement that each Kansas school district must spend 65 percent of its budget on instruction. There is a state law expressing a “public policy goal” that at least 65 percent of money provided by the state to “school districts” be spent on instruction, which reads as follows:


K.S.A. 72-64c01. Sixty-five percent of moneys to be spent on instruction. (a) It is the public policy goal of the state of Kansas that at least 65% of the moneys appropriated, distributed or otherwise provided by the state to school districts shall be expended in the classroom or for instruction.


According to the Kansas State Department of Education, in 2013-14 school districts spent $3,033,444,556 on instruction, which is 92.8 percent of total state aid provided in 2013-14 ($3,267,998,852). If $615 million from the 20 mill statewide property tax levy was included as state aid, spending on instruction equals 78 percent of this total.


However, Kansas school districts do not spend 65 percent of ALL revenues on instruction. Kansas spends about 52 percent of total revenues on instruction, ranking 22nd in the nation, and 62 percent of “current expenditures” on instruction, ranking 9th.


This means Kansas school boards devote a greater share of their annual operating budgets to instruction than 41 other states, but spend a smaller share of total revenues on instruction than other states. That is primarily because Kansas voters have approved spending a larger amount for classroom buildings and equipment than other states.


No state spends 65 percent of total funding on instruction. Only three states spend at least 65 percent of “current operating funds” on instruction.


State law does not - and should not - require all school districts to spend 65 percent of their budget on instruction, because districts have very different expenses they often cannot control. For example, districts paying for construction bonds approved by local voters, or transporting more students in rural areas, or with high special services costs for students with disabilities will have to spend more on those areas than districts that do not have those costs.


The budget classification for instruction leaves out significant expenditures that support student success and/or are required by law. Here is the most recent statewide breakdown of Kansas school district spending (2013-14 school year):


51.8% - Instruction: teachers, paraprofessionals, classroom aides, classroom materials.
17.4% - Capital costs and debt payments: construction, repair and remodeling of school buildings, including classrooms, libraries, gyms, auditoriums, lunchrooms, technology and other equipment.
8.1% - Maintenance and Operations: includes utilities, insurance and security.
3.4% - Transportation: busing or providing alternative transportation for students.
4.1% - Food service: lunch and breakfast programs.
4.1% - Student Support: counselors, social workers,psychologists, speech pathologists, audiologist, nurses, attendance and resource officers.
3.2% - Instructional Support: Librarians, technology support and staff professional development.
4.8% - School Administration: principals and school office support staff.
4.2% - All other: district administration, business operations, human resources and legal services.


In order to spend 65 percent of all funding on instruction, school districts would have to shift 13 percent of funding from other areas. This amount is more than the TOTAL spent on administration at the local and district level, PLUS all transportation costs.


Just as baseball teams can be successful in different ways, Kansas school districts strive to use their resources to fit their unique community needs and circumstances.


Kansas school boards are always looking at ways to operate more efficiently with the goal of putting more resources in the classroom to help produce successful students. KASB services and partnerships with other organizations are designed to help them in these efforts.


Directing districts to spend money on arbitrary statewide targets is the opposite of the local control and budget flexibility the Governor and Legislative leaders have been championing.