Thursday, October 20, 2016

Key Facts: What determines the level of school district cash reserves?

A new report from the Kansas State Department of Education shows school district ending balances for operating funds increased $50 million over last year. Why would district balances increase at a time many school leaders believe they are being underfunded? In other words, why put more money in the bank if you believe you aren’t able to spend enough on student programs, teacher salaries and other needs?


A closer look shows that school district cash reserves are reasonable for the state’s fiscal condition and other factors. Here are eight facts about district cash balances or reserves.


First, delayed state aid payments distort actual cash balances.


It’s important to recognize that the July 1 ending balance report is inflated every year because of delayed state aid payments. Since 2003, the state of Kansas has regularly delayed paying a portion of the final state aid installment of the fiscal year ending June 30 until some time in July.


By law, school districts are required to account for the money as having been received in June, but do not actually get the money until sometime in early July. That means the July 1 ending balance report is always inflated, usually by around $200 million. Last June (2015), the delay was $193 million.


This June (2016), with state tax revenues running far behind expectations, the delayed payment was increased to $260 million. Therefore, while the July 1 balances in district operating funds are about $50 million more than last year, the amount of money delayed (and not yet actually received by districts on July 1) is $75 million more than the previous year.


Second, some districts increased reserves in June because of fear that districts would not receive funding in July.


This June was a unique situation as Kansas school faced a possible shut-down order due to the Gannon school finance case. Without timely action by the Legislature, funding after July 1 could have been blocked by the Supreme Court. Districts may have delayed expenditures that normally fall in June or added to reserves to try to fund essential maintenance services during a shut-down.


Third, a big part of operating reserves really aren’t for regular operations.


Total school operating fund reserves, which exclude funds for capital outlay, bond payments and small revenues from certain local mill levies, are $920.9 million this year. However, that amount does include $242.3 million in funds restricted from general operating purposes.


These funds include $24.4 million in federal funds, which must be spent on specific purposes; $35.5 million in gifts and grants, which are usually restricted by the donor, such as for scholarships; $117.9 million for district insurance reserves; and $64 million for textbook and material purchases. Almost one-third of the $75 million increase was in federal funds, in part due to a change in the schedule of federal impact aid.


Fourth, cash balances are appropriate for the state’s financial climate.


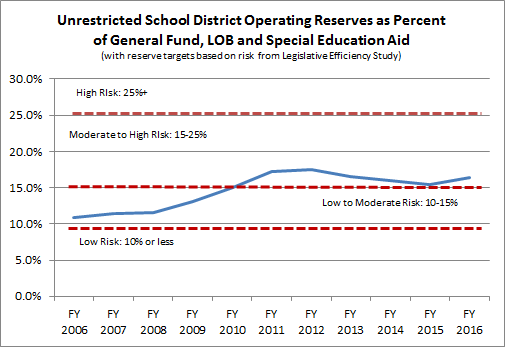
When these restricted funds are subtracted, the remaining balance of about $680 million equals approximately 16 percent of school district operating budgets (general fund, local option budgets and special education state aid), or about two month’s operating costs, or about 1 percent more than last year.


The Legislature’s own efficiency report from last session cites the Government Finance Officers Association (GFOA) recommendation that school districts maintain a balance of between 10 percent and 15 percent for “low to moderate risk” conditions; between 15 percent and 25 percent for “moderate to high risk;” and greater than 25 percent for “high risk.” On average, Kansas school boards - who approved budgets that include cash reserves - appear to believe the Kansas fiscal situation is at least “moderately” risky, given years of revenue shortfalls, credit downgrades, budget reductions and disappearing ending balances.


Cash reserves were slightly over 10 percent in 2006; increased to about 18 percent during and following the Great Recession; and have been declining since 2012 - until this year.


Fifth, many school leaders believe the state fiscal situation is at a higher level of risk.


The additional $75 million in payments was delayed to avoid a state general fund deficit. That comes on top of nearly $100 million in delayed school district aid for the Kansas Public Employees Retirement System. The state general fund has essentially no projected reserves. Some districts added to their reserves in anticipation of possible state funding cuts during the current school year if state tax revenues continue to lag.


Sixth, school district bond ratings are based in part on district reserves.


District bond advisers encourage districts to keep balances at levels recommended for financial, rather than political, reasons, which saves local and state taxpayers interest costs.


Seventh, district balances are high in July to provide cash flow for the rest of the year.


School district revenues and expenditures do not happen in tandem. For example, school districts had almost $200 million in special education balances last July 1, but that dropped below $60 million by March as special education costs outpaced special education state aid.


Eighth, like school districts, the State of Kansas cannot operate with reserves.


Although the state of Kansas frequently ignores its own 7.5 percent ending balance requirement for the state general fund, it is forced to borrow from other state funds through “certificates of indebtedness” to manage its own cash flow needs. The combination of ending balance and internal borrowing since 2007 has consistently been around 15 percent or higher.


The state’s borrowing would need to be even higher if not for the $200 million or more delay in school district aid payments. In other words, school district reserves help the state manage its own cash flow.


As these reasons explain, school district cash balances are determined by a number of factors, but there are rational, fiscally sound reasons for the way districts have been managing them.

Wednesday, October 19, 2016

Key Facts: How is school district funding determined and spent?

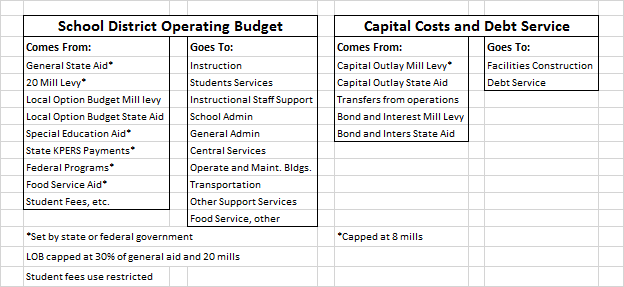
School spending is divided into two areas. The first, general operating expenditures, go to salaries, utilities and materials. The total amount of these funds is mostly limited by the state and federal governments, however, local boards decide how to spend what they receive.


The second, capital expenditures and debt payments go to acquire, build and equip facilities and pay for constructional bonds. The amount of these funds are mostly controlled by local school boards and voters. However, these funds can only be used for building costs and limited use for building maintenance.


As noted in the chart, most operating funds are set by the state or are based on federal appropriations. Districts may adopt a local option budget for operations, but the amount is capped at 30 percent of the general fund, which is set by the state Legislature (or 33 percent if the district holds an election).

Follow-up: Why do school districts spend money on buildings and other facilities when they are concerned about operating costs?

The amount of funding for general operating costs is set by the state. Many districts have reached the state imposed limit on what they can raise for local option budgets. However, districts can raise up to eight mills in local property taxes for building construction, upkeep and maintenance; and there is no limit on what local voters can approve for construction bonds. The dollars raised for facilities cannot be used for most salaries and operations even if the board would prefer.

Tuesday, October 18, 2016

Key Facts: How does Kansas school funding compare to other states?

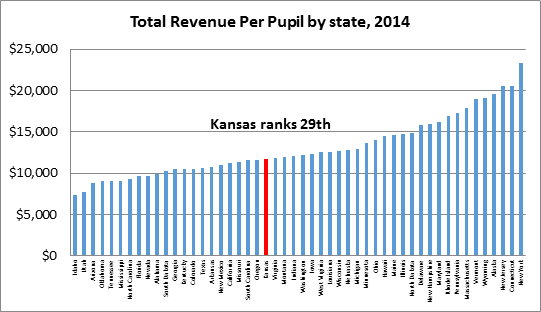
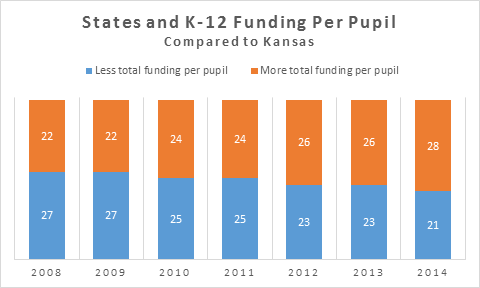
According to national reports which use headcount enrollment, Kansas funding per pupil in 2013-14 (the most recent year available) was 29th among the 50 states, a drop from 24th in 2008. Because most Kansas school aid was frozen under the block grant system for 2016 and 2017, and most states have been increasing funding, this ranking is expected to continue to decline.


Kansas also spends less of the total income of the population on K-12 education. According to the same national report, Kansas spent $42.74 per $1,000 of personal income, ranking 33rd in the nation.


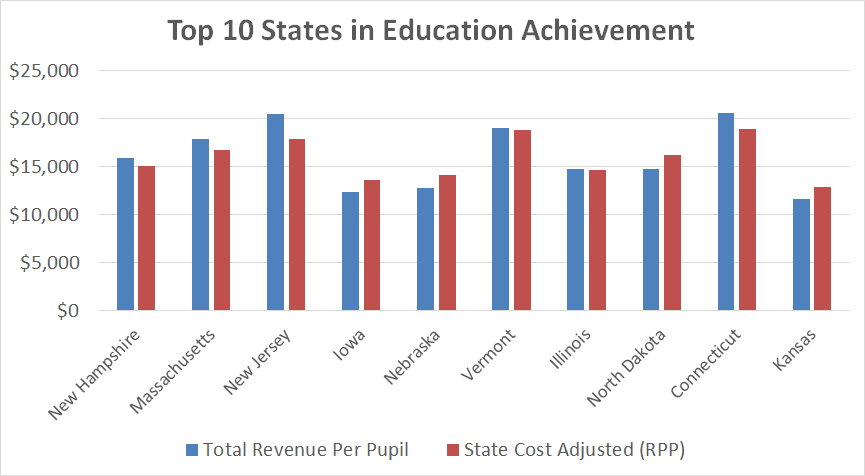
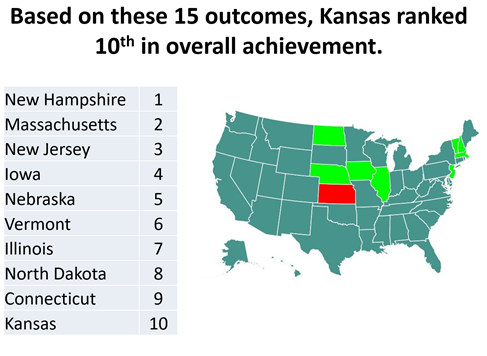
Funding per pupil is important because the nine states with highest overall achievement on 15 educational indicators all spend more per pupil than Kansas (KASB State Education Report Card). That’s true both in terms of actual dollars per pupil in 2014, and if per pupil spending is adjusted for state cost of living differences using the Regional Price Parity Index from U.S. Bureau of Economic Analysis.


In other words, Kansas educational performance is very high compared to other states, even though spending is below average. However, higher achieving states all spend more per pupil than Kansas.

Follow-up: Some say Kansas actually ranks as high as third or fourth in state funding for education. What is the conflict?

Kansas does rank high in the share of the state budget going to education. However, this doesn’t mean Kansas ranks high in total funding for education per pupil. Instead, it means Kansas has chosen to rely more on state aid and less on local revenues, which mostly come from property taxes. Most other states choose to have a different mix of funding for schools, but they also provide more total revenue. Another difference could be simple changes in accounting. The 20 mill statewide levy for school districts were previously considered a local revenues; now it is sent to the state and redistributed back to districts. That makes the “state” contribution higher, but provides no additional aid for districts.

Monday, October 17, 2016

Key Facts: How much does Kansas provide per pupil for K-12 education?

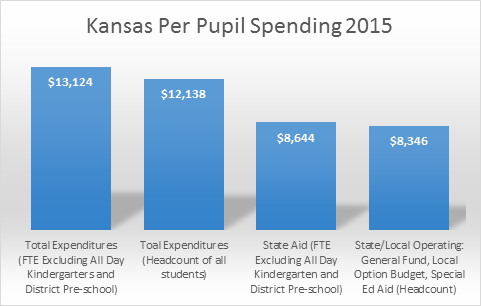
According to the Kansas State Department of Education website, Kansas school districts spent $13,124 per “full-time equivalent” pupil in school year 2014-15. This number includes all state and federal funds, all local revenues, all retirement costs and all student fee revenue, including student meals, books and other costs. This is the state average; individual districts may be higher or lower.


However, that number counts all kindergartners as half-time students, even though most kindergartners attend full-time. It also does not count more than 5,000 students in preschool programs funded by school districts. Using headcount enrollment, which counts all of these students, per pupil spending drops to $12,138.


If looking only at state aid (which would not include federal funding, local property tax revenue or income from student fees, but does DOES include KPERS retirement contributions), per pupil spending was $8,644 - using the FTE enrollment that does not count all day kindergarten students and district paid pre-schoolers. If looking only at state and local operating funds (district general fund, local option budget and special education aid, but NOT KPERS, building and equipment costs, federal programs, meals and student fees), per pupil spending is $8,346.


Follow-up: Some report lower numbers for Kansas spending per pupil. Why the difference?


As noted above, some comparisons use only state funding, or state and federal funding but not local revenues. Some may only use funding for operational costs and exclude spending on buildings and debt service. Some may exclude state contributions for the Kansas Public Employees Retirement System because these dollars cannot be used for school operations. Finally, some comparisons use only the base state aid per pupil amount from previous funding system, which was $3,852.


As a result, the “correct” answer about spending per pupil depends on what you really want to know, and why. For example, suppose an individual is seeking a loan and is asked “what is your annual income?” The individual will usually give their “take home pay.” That answer would probably not include fringe benefits and deductions for insurance and contributions for retirement, whether paid by the employee or the employer; and it certainly wouldn’t include the employer’s share of payroll for things like social security and unemployment. However, it’s the “right” answer for a lender who wants to know how much income the individual really has available to repay a loan, even though the employer is actually “spending” more than the employee takes home from a paycheck.

Likewise, in a local school district budget, much of the revenue is not available for regular educational operating costs, even if is being spent on other important costs.

Friday, October 14, 2016

Key Facts: How do Kansas education results compare to other states?

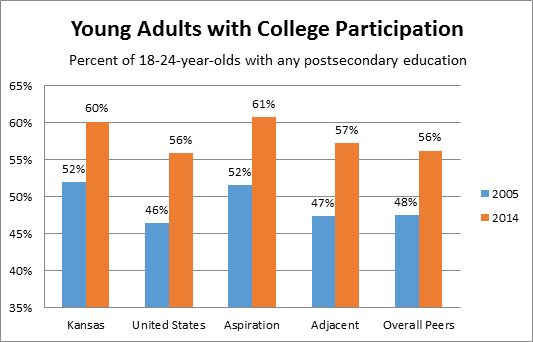
When considering multiple measures (test scores, graduation rates, postsecondary participation), Kansas ranks among the top states - 10th on the most recent report from KASB. Kansas ranks higher than the U.S. average, neighboring states, and states most like Kansas demographically.


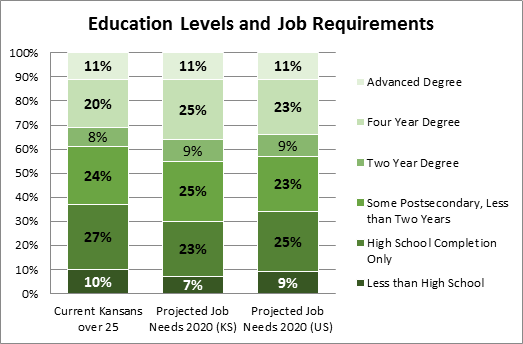
These results give Kansas students an advantage because higher education levels have higher average pay and employment rates, and more jobs in the future will require higher educational credentials.


However, on most of these measures, other states have been improving faster than Kansas in recent years, which means more states could begin to pass Kansas in achievement.


Follow-up: Some say Kansas performs only about average on national measures. Is that true?

It depends on the specific test or other measure. Like all states, Kansas does better on certain tests or with specific groups, and worse on others. That is why KASB uses an average of various tests, measures and groups of students, rather than any single indicator.