Thursday, October 27, 2016

Have school districts hired more educators or administrators in recent years?

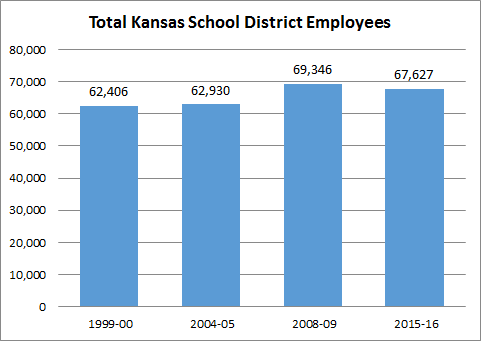
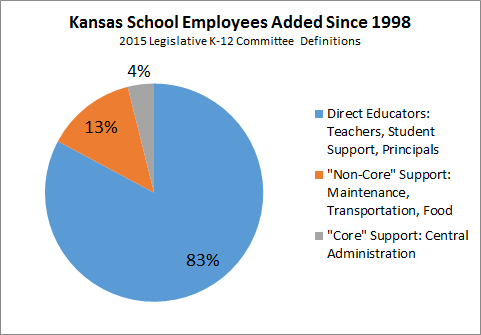
Out of nearly 8,000 school district positions added since 1998, 7,266 (82.8 percent) have been what a legislative study committee identified as “direct educators”; 1,171 (13.3 percent) have been positions not directly connected to instruction, such as bus drivers; and 341 (3.9 percent) have been in “core support,” which includes staff of central administrative offices (not necessarily superintendents and principals.) KASB report.


Since 1998, the number of superintendents has decreased by 27 (9.3 percent) and the number of principals dropped 76 (6.0 percent). The number of students, teachers and other support staff have increased, which means individual superintendents and principals are responsible for supervision and evaluation of more students and staff. KASB report.

Wednesday, October 26, 2016

What do school districts do with more (or less) money?

About 85 percent of school funding goes to school district salaries and benefits or to contracts for services that employ others receiving salaries and benefits. When operating funding increases, it generally goes to provide competitive salaries and benefits and to hire more people to provide additional services. KASB report.


From 2000 to 2005, total school employees increased by over 524 positions; from 2005 to 2019, employment increased an additional 6,415 following the Montoy funding, and as funding has fallen behind inflation since 2009, school district employment decreased by 1,719. KASB data tool.


Most of the rest of the funding increases in recent years have been for improving school district facilities for increased enrollment, expanded programs, energy efficiency, safety features and new technology.


Follow-up: Some say school districts have hired far more non-teachers than teachers in recent years. Is that true?

That is only true if not counting individuals who assist teachers in the classroom, but are not fully licensed teachers, such as special education paraprofessionals and regular classroom aides. Districts have hired more of these positions because licensed teachers may not be available, or because it is more efficient to hire these individuals to take over routine duties from regular teachers.

Tuesday, October 25, 2016

How has school funding changed compared to inflation and other cost indicators?


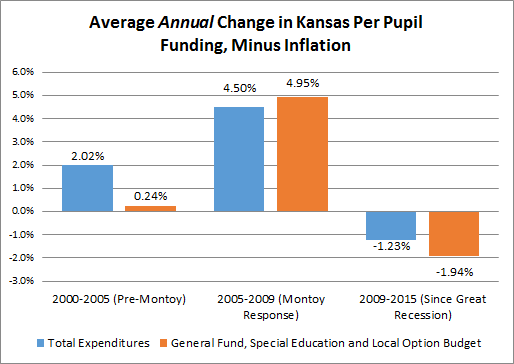
Since 2000, school funding increased somewhat more than inflation before the Supreme Court Montoy decision in 2005; increased significantly for four years as the Legislature responded to that decision which said school funding was too low; and has averaged less than inflation since the Great Recession in 2008-09.


From 2000 to 2005, total expenditures per pupil (using the full-time equivalent enrollment that does not count full-time kindergartners and district-funded preschoolers) increased an average of 2.0 percent more than inflation per year.


Looking only at general fund, special education state aid and local option budgets, spending per pupil increased just one-quarter of one percent more than inflation. (Total expenditures include building construction costs and payment of debt for construction bonds, as well as KPERS pension contributions, federal funds, food service and fees that are not included in general fund, special ed and LOB.)


From 2005 to 2009, following the Supreme Court order to increase K-12 funding after the Montoy decision, total funding increased an average of 4.5 percent per year more than inflation. General fund, special ed and LOB spending increased almost 5.0 percent more. During the period, the Legislature substantially increased funding for at-risk, bilingual and special education students, and increased local option budget authority.


From 2009 to 2016, total per pupil funding has decreased an average of 1.23 percent per year after adjusting for inflation. General fund, special ed and LOB funding decreased almost 2.0 percent more.  As a result, when adjusted for inflation to 2015 dollars, school funding is below 2009 levels, although unadjusted dollars are higher.


Follow-up: Some say because school funding is higher than inflation if you count increases in the 2000s, school districts should have enough money to operate.


School district costs are rising faster than inflation. From 2000 through 2015, the U.S. Employment Cost Index (a measure of changes of salaries and benefits for all public and private sector employees) increased an average of 0.5 percent more than inflation. From 2005 through 2015, the U.S. School Building Cost Index increased more than 2 percent more than inflation (this measure has only been available since 2005).

In addition, the needs of students have changed. There are far more low income students, who have less family support; bilingual students, who need special assistance in other languages; and students with severe physical and emotional needs, who need high cost specialized services.

Monday, October 24, 2016

Key Facts: How have Kansas school district spending choices changed?

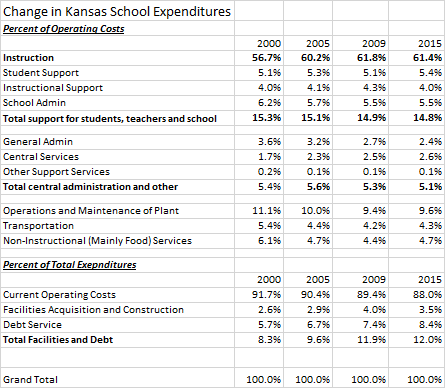
School districts have directed more operating dollars to teaching and to programs helping students, and reduced the percentage of operating spending on almost everything else. The total dollars available for operating costs are limited by the state and federal government. Capital expenditures for buildings and payments for school construction bonds, which are approved by local voters, have been increases more than operating costs.


According to data from the Kansas State Department of Education, in 2015 school districts spent 61.4 percent of operating funds on direct instruction (teachers, special education paraprofessionals, classroom aides, coaches and classroom materials), up from 56.7 percent 15 years ago.


Districts spent 5.4 percent of operating funds on student support programs (such as counselors, nurses, attendance officers, social workers and school psychologists); up from 5.1 percent in 2000, and 4.0 percent on teacher support (libraries, media centers and professional development); the same percent as in 2000.


Spending on school administration (principals and school office personnel) dropped from 6.2 percent to 5.5 percent. Central administration costs are 5.1 percent of operating costs, down from 5.4 percent.


Operations and maintenance costs, which include utilities, insurance, custodial services and security, make up 9.6 percent of operating expenditures, down from 11.1 percent. Transportation costs for students to and from school and activities is 4.3 percent, down from 5.4 percent. Non-instructional spending, which is mostly food service programs (breakfast and lunch) is 4.7 percent, down from 6.1 percent.


Operating expenditures dropped from 91.7 percent of total expenditures to 88.0 percent. This is primarily because local voters have approved school construction bonds at a faster rate than the Legislature has approved increases in general operating aid and local option budgets (which are limited by the state). Local boards and voters cannot shift funding from building and equipment funds to operating funds.


Follow-up: Some say only about half of student spending actually “gets to the classroom.”

That’s only true if you accept the idea that “instruction” is the only thing that matters “in the classroom.” However, student learning in the classroom would not be possible without the other areas of the budget - including buildings and operating the classroom, supervising and supporting teachers, and transporting, feeding and providing support services for students.

Friday, October 21, 2016

New study finds Kansas funding falling behind highest achieving states

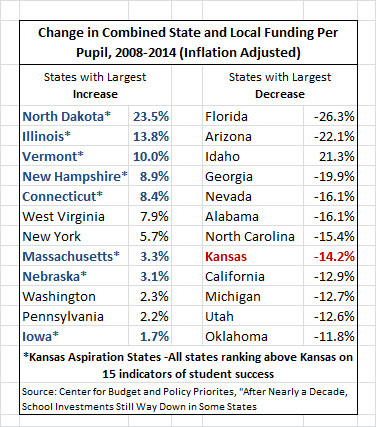
A new study of K-12 education funding in the United States finds that Kansas had the eighth largest cut in per pupil funding between 2008 and 2014.

Only 14 states increased funding over that time after adjusting for inflation, and all nine states that outperform Kansas on KASB’s State Education Report Card are in that group. This means the nine highest performing states in the nation are all among the 14 states that increased per pupil spending the most since the Great Recession began in 2008.


KASB’s report card ranks states on 15 indicators of student success, including national test scores, graduation rates and postsecondary preparation, participation and completion, for students and subgroups. Only nine states have a higher overall ranking than Kansas. KASB identifies these as “aspiration states” because they exceed Kansas on overall education outcomes.

All nine aspiration states spend more per pupil than Kansas, and all nine increased state and local funding more than inflation since 2008, according to the study from the Center for Budget and Policy Priorities, a national think tank.

The CBPP study found Kansas per pupil funding declined by 14.2 percent since 2008 after adjusting for inflation. According to the KASB data from the Kansas State Department of Education, unadjusted per pupil funding in Kansas is higher than 2008, but those increases have been less than the total increase in the consumer price index over that period.

KASB’s education report card contains similar data, but does not adjust for inflation. It found that the “aspiration states” increased total funding for pupil much more than Kansas since 2008.

The report card found that although Kansas continues to rank high in achievement, has not been improving as fast as most other states on education measures over the past decade. Although most Kansas educational outcomes have improved, they have not improved as much as many other states. Over the same period, although Kansas school funding has increased in dollar amounts, it has not increased as much as most other states.

The CBPP report confirms these school funding trends, showing that Kansas per pupil funding has fallen behind both inflation and most other states.

Because jobs and income levels are increasingly linked to education levels, state with the best educational outcomes are likely to have the best economic outcomes. The data shows that the highest achieving states are also among the states that have invested in most in education.