
One of the most important debates about educational achievement is the role of funding. This week, the Kansas Supreme Court heard arguments in the Gannon case. The plaintiffs argue that the state is failing to meet its constitutional obligation to “provide suitable finance for the education interests of the state” because funding levels have been reduced or have not kept up with costs. The defense says that Kansas student achievement is quite high, suggesting overall funding levels are adequate. Others argue Kansas doesn’t need to spend more money on education because higher funding doesn’t result in better outcomes.
To test these contentions, KASB studied the results of the 2011 National Assessment of Educational Progress (NAEP) and other state data from the National Center for Education Statistics. Here’s what we found: higher achieving states almost always spend more than Kansas and there is a positive statistical correlations between higher spending and better results. These results follow an earlier study that showed states with higher spending have higher college readiness results on the ACT test.
The NAEP is given to a sampling of students in all 50 states every two years. (This allows state scores to be reported but not individual district or student scores.) Students are tested in reading and math at grades four and eight. In addition to an average “scale score” in each state, NAEP also reports the percentage of students scoring at certain benchmark levels: Below Basic, Basic, Proficient and Advanced.
KASB research has shown that the percentage scoring at Basic is a good indicator of the state’s graduation rate, i.e. the percentage of students who complete high school. The percentage scoring at Proficient is a rough indicator of the percentage of students who will meet college readiness benchmarks on the ACT test. In other words, the percent at Basic might be considered the percentage of student “on track” to graduate, and the percent at Proficient indicates those “on track” to be ready for college-level academics.
Kansas ranks among top performing states
To measure overall state performance, we calculate the average of the percentage of students scoring at both Basic and Proficient on the four tests (Grade 4 reading and math; Grade 8 reading and math). We then rank the average percent for each state. The results are shown in Table I near the end of this story.
Eight states top the nation with average scores of 80% or higher at Basic for all students. Kansas is just outside this group, ranking 9th at 79.8%. Ten states rank at the bottom with scores below 70%. Likewise, 12 states top the nation with 40% or more students scoring at Proficient or higher, including Kansas. Nine states have less than 30% at Proficient.
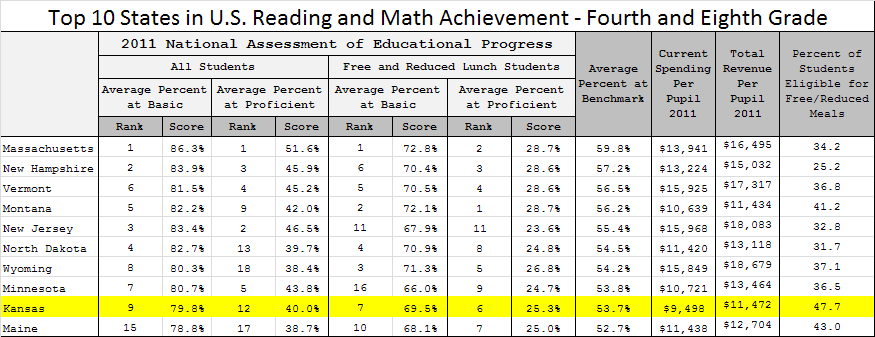
As explained in an earlier post, lower income students usually score much lower than upper income students. To see how states perform in educating their lower income at-risk students, we used the same approach to average the percentage of students eligible for free or reduced lunch who score at Basic and Proficient on the four tests. The percentage of low income students meeting these benchmarks is generally about 10 points or more lower than all students.
Six states have 70% or more low income students at Basic, with Kansas ranking 7th at 69.5%. Thirteen states have less than 50% of low income students at Basic. Seven states have at least 25% of low income students at Proficient, including Kansas (6th at 25.3%). Ten states have fewer than 18% of low income students at Proficient.
Averaging these four state percentages (all students at Basic and Proficient, low income students at Basic and Proficient), Kansas ranks 9th (53.7% average percent at benchmark). It’s clear that Kansas ranks among or just below the highest achieving states in the nation, both for all students and specifically for low income students. What are we spending to get those results?
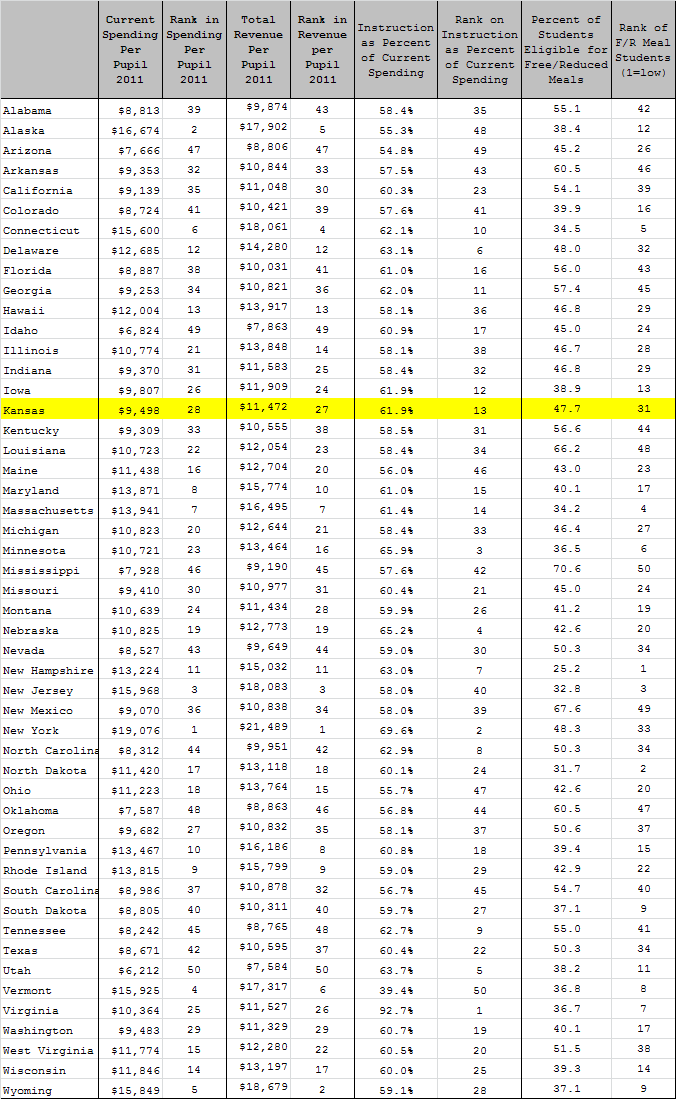
Using the most recent national data (for the 2010-11 school year), Kansas ranked 27th in total revenue per pupil at $11,472. (Total revenue includes ALL school districts revenue from state, federal and local sources.) Kansas ranked 28th in the nation in current spending per pupil at $9,498 (Current spending excludes long term expenditures such as buildings and equipment, payments on loans and pension costs.) Kansas also had a fairly high percentage of low income students: 47.7%, compared to the national average of 48.1%. In fact, 30 states have a lower percentage of low income students than Kansas.
National Test Results and Education SpendingAt first glance, this data would seem to support the state’s claims in the Gannon lawsuit. Kansas schools are producing very high results compared to other states, while spending below the national average. Kansas also ranks very high even though most states have fewer low income, at-risk students. In fact, Kansas ranks even higher for low income students than it does for all students. Do our own achievement results indicate current funding is “suitable?” It would seem to depend on whether the status quo is acceptable or “suitable.” The Kansas Constitution mandates a system of public schools for “intellectual, educational, vocational and scientific improvement,” which the Supreme Court has said indicates the status quo is never good enough, because the people have mandated continuing improvement.
Even if the constitution itself doesn’t mandate improvement, the constitutionally elected State Board of Education has continued to set higher standards. Most critics of Kansas public schools claim educational achievement falls short of the mark. Economic data indicates Kansas must increase the percentage of high school graduates and college-ready students to meet future employment needs and provide “middle class” incomes. In addition, the testing and funding data presented above is several years old, and new national reports have indicated Kansas has further reduced spending compared to most other states.
If the question is not what it costs to achieve current results but what it costs to achieve even higher results, here are some key facts to consider.
- With just two exceptions, every state with a higher percentage of all students and low income students meeting Basic or Proficient benchmarks spent more per pupil than Kansas in 2011.
- Colorado, which had both lower current spending and total revenues per pupil than Kansas, ranked higher on just one benchmark (all students at Proficient). Montana had over $1,000 higher current spending per pupil than Kansas, but just slightly lower total revenue per pupil ($38, or 0.3%).
- Both Colorado and Montana had far fewer low income students than Kansas. Colorado had 39.9% and Montana 41.2% students eligible for free and reduced meals, compared to 47.7% in Kansas. Colorado also had much lower achievement for low income students, ranking 22nd at Basic and 19th at Proficient - about 15 spots lower than Kansas.
KASB also looked at the statistical correlation between spending per pupil in each state and the percentage of students at NAEP benchmarks. In each case, we found a positive correlation as follows:

Although there is no hard and fast rule for the strength of statistical correlation, many sources suggest that a positive correlation of 0.4 and above is a moderate to strong relationship, and that a correlation of 0.3 is a moderate relationship. Even a correlation above 0.2 indicates at least some relationship.
The totality of the evidence indicates that funding does play an important role in state student achievement and that it will be extremely difficult - and, in fact, unprecedented - for Kansas to improve achievement on NAEP results without additional revenues.
Table I
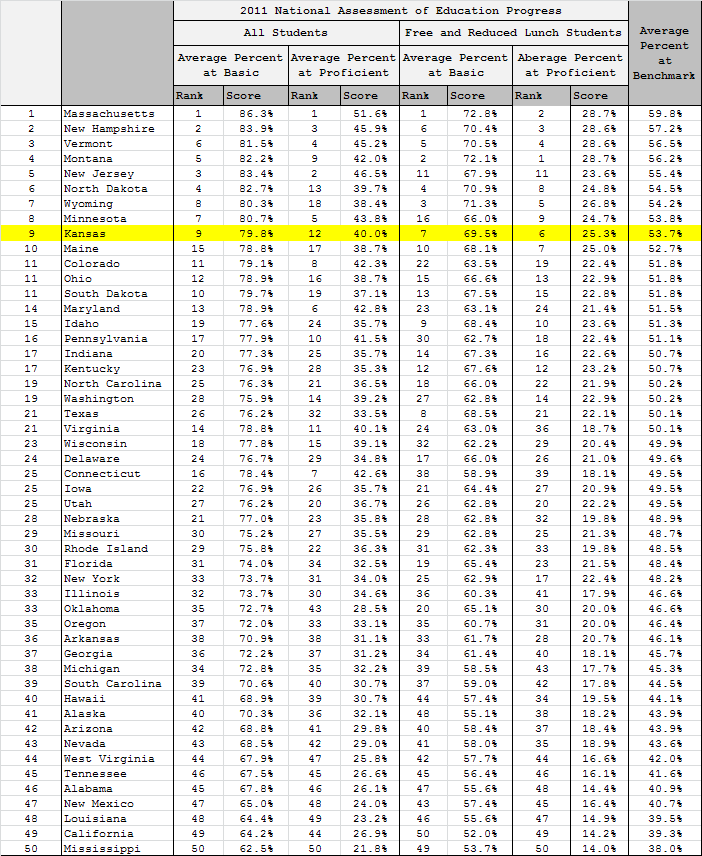
Table II:
No comments:
Post a Comment
(Comments on this blog are moderated.)