
Wichita blogger Bob Weeks has an interesting post and video that makes several points about evaluating educational performance. First, it is important to consider characteristics of the student population which can have an impact on results. Second, it is important to consider as much data as possible to see the full picture.
Mr. Weeks reviews the results of the 2011 National Assessment of Educational Progress for Kansas and Texas. The NAEP tests a sampling of students in each state at grades four and eight in reading and math every two years. Overall, Kansas students score higher on the NAEP than those in Texas. Kansas spends more per pupil than Texas, and KASB has compiled evidence that both nationally and regionally, states with the best achievement on a variety to educational achievement factors tend to spend more per pupil than states with lower achievement.
However, Mr. Weeks points out that Texas actually has higher “scale scores” than Kansas for racial or ethnic “subgroups” on most tests. Like Kansas and other states, Texas has a “significant achievement gap” among these groups, with non-white students usually performing at lower levels than white students.
“In Kansas, 69 percent of students are white,” he writes. “In Texas it’s 33 percent. This large difference in the composition of students is what makes it look like Kansas students perform better on the NAEP than Texas students. But looking at the scores for ethnic subgroups, which state would you say has the most desirable set of NAEP scores?”
These results raise important questions about student achievement. Texas spends less per pupil than Kansas - but Kansas also spends less than the national average. We wanted to dig deeper into student characteristics and educational outcomes in comparing Kansas and Texas to each other and the nation as a whole.
Factors OUTSIDE of school have a big impact on achievement IN school
To begin with, KASB absolutely agrees that differences in student characteristics must be considered in evaluating educational performance. I made exactly the same point in my August 14, 2013 blog post "Celebrating Back to School Success" when I noted that student performance for all student subgroups, especially minority students, has been growing faster than the overall average, because minority students compose a growing portion of the U.S. and Kansas population. When critics says student performance hasn’t improved very much, they rarely note that overall performance would be much higher if the student population was the same as in 1970, 1985 or even 2000.
However, the most important factor in student performance isn’t race or ethnicity, but socio-economic status. As a group, lower-income students, usually measured by eligibility for free or reduced lunch, have much lower performance than middle- and upper-income students. Non-white students also tend to lag behind - because they are more likely to be from low income families.
Studies have shown for decades that lower income students lag behind their peers. There are many reasons. Lower income parents tend to have lower education levels themselves, and may provide less academic support at home. Low income children are exposed to a much smaller vocabulary. Low income students are more at-risk for deficiencies in basic needs, like food, health care and even shelter. Parents in lower income families are more likely to be absent, neglectful, substance abusers or incarcerated. Children in these circumstances simply face more distractions from academics than more affluent children from stable homes and better educated parents who promote education.
These factors have nothing to do with race. Economically advantaged minority students can be just as successful as white students. Likewise, lower-income white students also struggle academically.
While Kansas and Texas students are considerably different in racial make-up, they are surprisingly similar in terms of socioeconomic status. As noted above, 68 percent of Kansas students were white in 2010-11, compared to just 31.2 percent of Texas students. However, 47.7 percent of Kansas students were eligible for free or reduced lunch, compared to 50.3 percent of Texas students. In other words, only 2.6 percent more Texas students are low income than Kansas students. Both were close to the national average of 48.1 percent. And although it was not noted in Mr. Weeks’ blog, Kansas low income students AND non-low income students have higher NAEP scores than Texas.
Kansas usually exceeds Texas on NAEP scores when considering family income
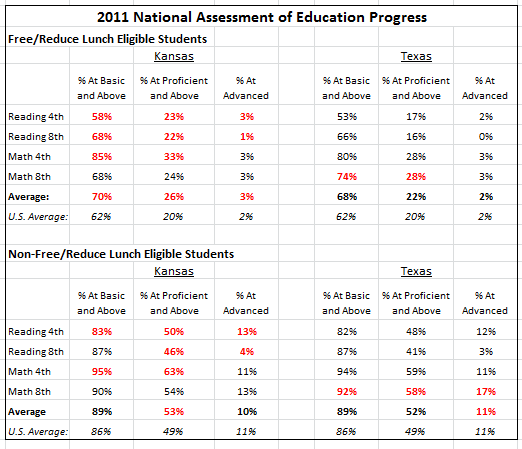
Rather than looking only at “scale scores,” we examined the percentage of students scoring at each of the three main achievement levels reported by NAEP: basic, proficient and advanced. We have found that a score of “basic” is a fairly good indicator that the student is on track to graduate from high school, while “proficient” is a rough predictor of college readiness on ACT or SAT tests.
As the chart below indicates, low income Kansas students did better on eight of the twelve tests; Texas students did better on two, and two were a tie. (The higher score is in red.) In both states, low income students made up about half of the student population. For higher income students, Kansas had better results on seven of the twelve tests, Texas on three, and two were tied.
However, NAEP tests are only one measure of student achievement, and the highest level tested is eighth grade. Since few students will be successful based only on eighth grade knowledge and skills, we wanted to look at how Kansas and Texas do preparing students for success after high school.
Kansas and Texas Graduation Rates
We started with high school graduation and dropout rates from the following sources: the 2013 Diplomas Count report, the Digest of Education Statistics table 125 (public high school graduates and graduation rates by state), the Digest of Education Statistics table 126 (the number and percentage of grades 9-12 dropouts by state), the Digest of Education Statistics table 13 (percentage of persons age 18-24 who were high school completers), and U.S. Department of Education adjusted cohort graduation rate for 2011.
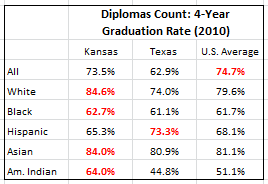
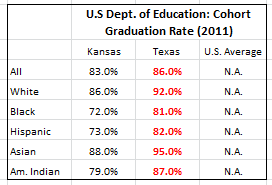
The first report is the respected “Diplomas Count” annual survey of four-year graduation rates (students who achieve a high school diploma within four years of beginning ninth grade). It shows Kansas graduating roughly 10 percent more students than Texas as a whole, with better results in every major subgroup except Hispanics. Kansas also exceeds the national average for every group except Hispanics and all students.
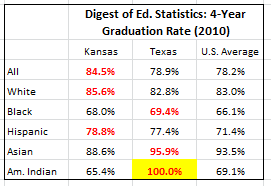
The second report is from the most recent “Digest of Education Statistics” from the U.S. Department of Education. Unlike “Diploma Count,” this report shows Kansas significantly higher than the national average for all students, including Hispanics. It also shows Texas with a better graduation rate than Kansas for Blacks and Asians. (In a likely data error, it shows a 100 percent graduation rate for Native Americans, which is contradicted by the next report on the dropout rate from the same source.)
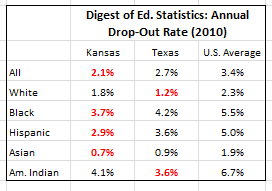
The Digest of Education Statistics also reports on each state’s dropout rate, which is a different calculation than the graduation rate. It is the number of students who drop out anytime during grades nine through twelve, divided by the total number of ninth through twelfth-graders. This report shows Kansas with a lower (better) dropout rate for all students, as well as Blacks, Hispanics and Asians, while Texas has a lower rate for Whites and American Indians.
However, a different calculation for high school graduates was released last year by the U.S. Department of Education for the class of 2011, which is a year later than the other data. This new report shows Texas topping Kansas for every group, and reports Texas has much higher rates than any other study. It will take some time to determine whether Texas actually made significant improvements between 2010 and 2011, or if there is some different methodology that produces significantly different results.
This means we have three different national reports on the graduation rate for students within four years of ninth grade that give significantly different results.
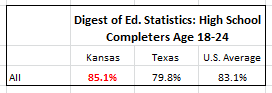
The final report on high school completion also comes from the Digest of Education Statistics. Unlike the other data, which looks at graduates and dropouts as a percentage of the high school class or population, this report measures the percentage of persons in the entire population aged 18 to 24 who have received a high school diploma or the equivalent. Essentially, this captures young adults who did not complete high school “on time,” but have received a secondary school credential within five years of “normal” graduation age through an alternative program. Kansas leads both Texas and the national average. Unfortunately, this data does not include subgroups.
Although this data is frustratingly mixed, it should be noted that Kansas exceeds the national average on every report where a national average is given except one. Yet Kansas is very close to the national average in low income students - in fact, 30 states have had a lower percentage of free and reduced lunch eligible students in 2011, including every state in the region except for Texas and Oklahoma.
Texas is below the U.S. Average on SAT scores; Kansas tops U.S. on ACT
Finally, we want to look at how well students are prepared for college. Unfortunately, direct comparisons between Kansas and Texas are not possible because most Kansas high school graduates take the ACT and most Texas graduates take the SAT. However, we can compare both states to the national average of their majority test.
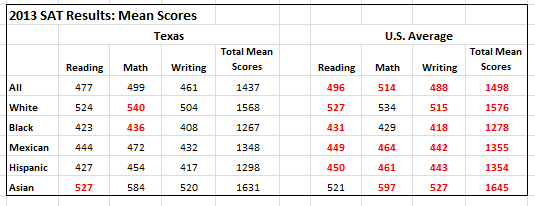
The 2013 SAT results for the graduating class of 2013 were just released. The only Texas groups that exceed the national SAT average were Whites and Blacks in math, and Asians in reading. None of the total group scores for Texas exceed the national average. (We are only listing results for groups that included at least 5 percent of the group tested. Note also that SAT allows students to identify as “Mexican or Mexican-American,” or as “Hispanic, Latino or Latin American.”)
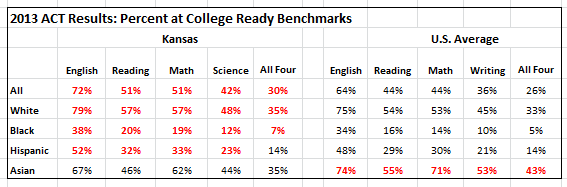
The ACT testing program reports not only mean scores of tests, but reports the percentage of students whose scores indicate a strong likelihood of completing college-level work in that subject. As the table below shows, all Kansas students and every subgroup except Asians exceed the U.S. average in every subject. Kansas Hispanics tied the U.S. average for meeting all four subject benchmarks.
In 2013, ACT reports 75 percent of Kansas high school graduates took the ACT. Although SAT does not report the percentage tested by state, the number of Texas students tested would equal 59 percent of estimated high school graduates using the same source as the ACT. Generally, a higher percentage of students tested lowers than the overall state performance (because the higher number includes more students with less ability, preparation or motivation). However, Kansas does much better compared to the national average of its primary college aptitude test than Texas, despite testing a higher percentage of students.
These results show the limitations of reliance on any single measure of educational performance. Mr. Weeks’ blog stressed the importance of looking beyond single indicators. It is clear that Texas does better than Kansas on the NAEP when considering racial and ethnic subgroups, but Kansas does better educating low income students. Measures of high school completion are also mixed, but Kansas does better for all students and a majority of subgroups on three out of four national reports. However, Kansas clearly does better in college preparation when compared to the national average on its primary test for all students and most subgroups, while Texas does worse than the national average for the SAT for all groups and for subjects tested.
Both Kansas and Texas spent below the national average per pupil in 2011. According to the National Center for Education Statistics, Kansas ranked 27th in total revenue per pupil at $11,427. Texas ranked 37th, spending about $900 less. Based on the totality of student performance, which state is getting the best results?
Mark - You state in the blog that "... the most important factor in student performance isn’t race or ethnicity, but socio-economic status." I don't disagree but wondered if you had empiral evidence to support this. Suppose a regression analysis would be the way to go and wondered if you had run one or could site other research.
ReplyDelete