Thursday, May 29, 2014

Mapping student achievement, poverty and school funding

The KASB advocacy tour is in Liberal, where we will hold an advocacy breakfast meeting before heading to Garden City for a lunch meeting and hold a briefing for Legislative candidates this afternoon. We'll wrap up the first week of the tour Friday morning in Dodge City.

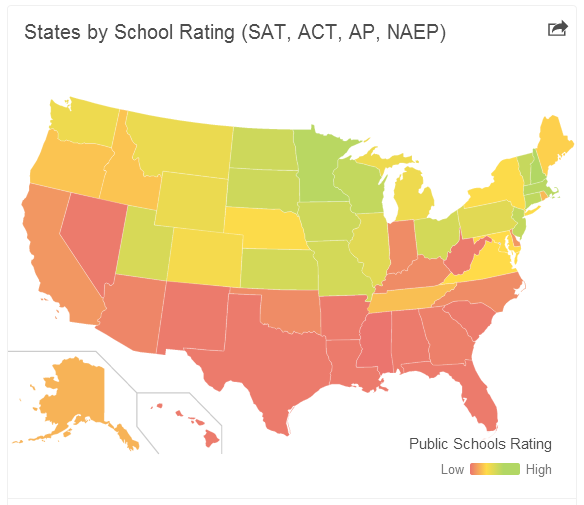
Earlier this week, KASB social media followers posted the map shown below, from the search engine FindTheBest. It shows how states rank on a several national academic tests.  States in dark green had the highest results; light green for the next best (including Kansas); followed by yellow, orange, tan, light red and dark red.  Quite clearly, the New England, middle Atlantic and Midwestern states have the best performance, while southern and western states do the worst.

For KASB, I have used a somewhat different way of ranking states that includes high school graduation and adult education levels, but the results are similar.


Yesterday, another map was posted by Kansas Action for Children that shows some of the reasons for - or consequences of - differences in student achievement.  This map, from the Kaiser Family Foundation state health facts section, shows the percentage of persons age 18 and under in poverty by state.


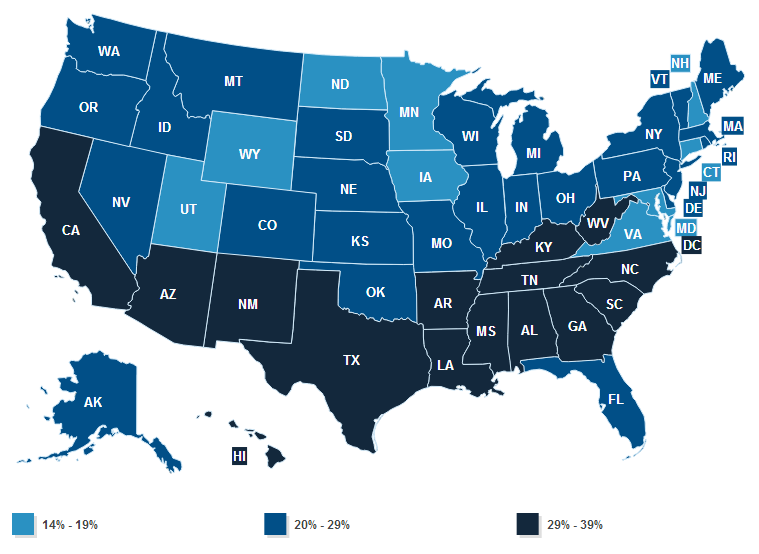
Strikingly, most states with the lowest poverty are among the higher achieving states on national tests, while the south and southwest tends to have high poverty and low achievement.  Why?  Students from low income families tend to have more difficulty reaching higher levels in school, and families whose parents have lower education levels are much more likely to have lower incomes.  Poverty is therefore both a cause and effect of lower student achievement.

Finally, here is a third map from the U.S. Census Bureau’s Public Education Finances: 2012 showing current spending per pupil for each state.  Note that the highest spending states are in the northeast, which generally also have higher student achievement and less poverty.  On the other hand, most of the lowest spending states range across the south and southwest, with lower student achievement and higher poverty rates.


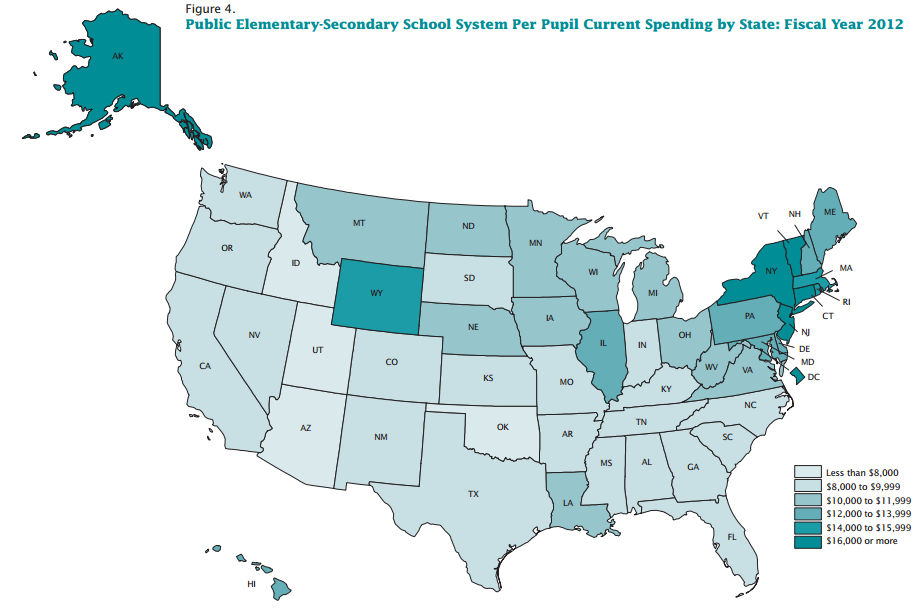
These three maps strongly indicate that higher spending on K-12 education not only results in better student, but also creates more economic prosperity by reducing childhood poverty.

One media outlet suggested the first map shows a new "Mason-Dixon Line" for educational achievement, referring to the old division between north and south before the Civil War. That line appears to extend to poverty and educational support as well. Which side of the line should Kansas be on?

Wednesday, May 28, 2014

12th Grade National Tests: No Growth, Low College Readiness, and Funding Makes a Difference

The Tallman Education Report comes from Hays, Kansas today as KASB begins its 2014 Advocacy Tour with a breakfast event, followed by a meeting at noon in Oakley.  We will continue through western Kansas this week, in Liberal and Garden City tomorrow (Thursday) and Dodge City Friday.

Yesterday, I talked about a new report on high school graduation rates celebrating an all time high percentage of high school completion nationally.  However, this good news was undercut by a second national report, the 2013 National Assessment of Educational Progress 12th Grade reading and math tests. Three things stand out.

First, national results are basically unchanged since the test was given four years before in 2009. That is different from the 4th and 8th grade NAEP reading and math assessments, which have shown upward movement nationally and in most states.  One reason may be that the higher graduation rate means more students who previously would have dropped out are staying in school and being tested.  In other words, flat scores can still indicate progress if schools are getting the same results when a more challenging group of students are included.

Second, only about one-fourth of students score at the “proficient” level in math and only one-third are proficient in English.  I’ve found these results are roughly equal to the percentage of students meeting “college ready” benchmarks in the ACT and SAT.  This indicates only about 25% of all students (not just those who take the ACT or SAT) are really ready for college level math and 36% for college level English.  These levels fall short of national estimates that between 60% and 70% of future U.S. jobs will require some level of college education.

Third, these tests are another indication that the amount of state funding for K-12 education is linked to results.  Unlike the 4th and 8th grade tests which are reported for every state, no 12th grade scores are released for most states, including Kansas.  However, 13 states participated in 2013 on a pilot basis where a statistically reliable state results can be given.  The results are shown in the chart below:


Because of the on-going to debate over the link between school funding and performance, we wanted to see if there is a relationship between the percent of students scoring at or above proficient (college ready) and total K-12 revenues provided in each state, based on the latest national data in Public Education Finance: 2012 from the U.S. Census Bureau.

To provide a common scale for comparison, we calculated each state’s test results and total funding as a percent of the U.S. average.  For example, the chart shows that Massachusetts, which has the highest percentage of students scoring proficient or higher in math, is more than 30% above the national average.  Revenue per pupil in Massachusetts in also more than 30% above the national average.

Here are the results for the mathematics test:


The chart shows a clear correlation between higher spending and higher achievement, and lower spending and lower achievement.  Of the seven states with higher math achievement than average, all but South Dakota and Iowa also spent above average, and Iowa is very close the U.S. average in both achievement and spending.  Michigan is even closer.  On the other hand, of the five states with math proficiency below the U.S. average, all but West Virginia also spent below average.

There are other factors that affect student achievement - most significantly, the percent of low income students - but this data clearly shows that that highest achieving states on this assessments are more more likely to spend more per pupil; and lowest spenders are more likely to have lower achievement.

That's a challenge for Kansas, which spends BELOW the U.S. average.


Tuesday, May 27, 2014

Graduation rates hit new high but troubling issues remain

It’s that time of year: high school commencements are mostly completed, the school year is ending, and the Tallman Education Report will be on road for the Kansas Association of School Boards summer advocacy tour for the next five weeks.

The tour start tomorrow in Hays with a 7:30 a.m. breakfast meeting, followed by a noon lunch meeting in Oakley; the first of 23 stops across Kansas to talk with school board members and other leaders about the future of Kansas public education.  In particular, we will focus on the so-called “Rose” standards identified by the Kansas Supreme Court as the threshold learning levels for every child and adopted by the 2014 Legislature as the goals for K-12 education.  We will be exploring what those standards are, how they measured, how Kansas “measures up” and how we can improve the performance of our students and schools.

The Rose standards really speak to preparing students for successful lives.  We can celebrate some good news about one standard of achievement: a new report finds that the U.S. graduation rate hit an all-time high of 80% in 2012.  Kansas topped the national average at 85%, ranking 14th in the nation.

I’ve developed the following chart from information in that report, based in the most recent national data from the U.S. Department of Education.


Over the past 10 years, the national graduation rate for students within four years of starting high school rose from below 75% to 80%, while in Kansas it increased from 77% to 85%.  Kansas previously trailed its 10-state region (North and South Dakota, Minnesota, Nebraska, Iowa, Colorado, Missouri, Oklahoma and Texas), but now slightly exceeds the regional average.  Kansas also does better than the 10 states with most similar percentage of low income students - the key demographic in student achievement - and slightly gained ground on the top 10 states in overall graduation rates.

Despite this positive news, there are some important issues to face.  First, having the highest graduation rate ever still isn’t high enough to meet the projected needs of students, the state and the nation.  Experts says by 2020, approximately 90 percent of jobs will require a high school diploma, which means even Kansas is falling about five percent short.  Students who fail to complete high school simply won’t quality for most jobs.

Second, students from middle-income and higher-income families are already at that target: the new report shows that 95% of these students in Kansas graduated on time in 2012.  However, only 76% of Kansas students who were eligible for free or reduced price meals graduated on time in 2012.  That is still above the national average of 72% for low income students, but the 19% income level gap in Kansas is higher than the 15% gap nationally.

Third, the percentage of low-income students has risen sharply both nationally and in Kansas.  In 2001, 38.3% of students nationally and 33.4% of students in Kansas qualified for free or reduced price meals.  By 2012, the numbers were 49.6% nationally and 48.9% in Kansas.

Finally and most important, the income gap creates a vicious downward cycle. Low income students are more likely to fail to complete high school on time, which means they are also less likely to ever graduate and receive additional postsecondary education.  High school drop-outs have much lower salaries and much higher poverty rates than than individuals who finish high school, and earnings further increase with every level of postsecondary education attained.

In other words, because lower income students are more likely to drop out of high school, they are also much more likely remain in poverty or at low income levels - which means their children will also be more at-risk of dropping out.  The changing national and state economy has sharply reduced low skill jobs and kept these wages low - which helps explain why the percentage of low income students is growing.

We will examine all of these issues at the KASB advocacy meetings and through this blog in the coming weeks and months.