
Some legislators note that Kansas ranks third in the share of the state budget that is dedicated to public schools, but when considering all funding for education — which legislators say it is important to do — Kansas ranks below the national average. And when it comes to student achievement, the amount of dollars seems more important than the source of the funding.
Per Pupil Funding - All Revenues
When all school revenue sources are considered - federal, state and local - Kansas spends $11,596 per pupil, about $800 below the U.S. average and ranking 27th in the nation.
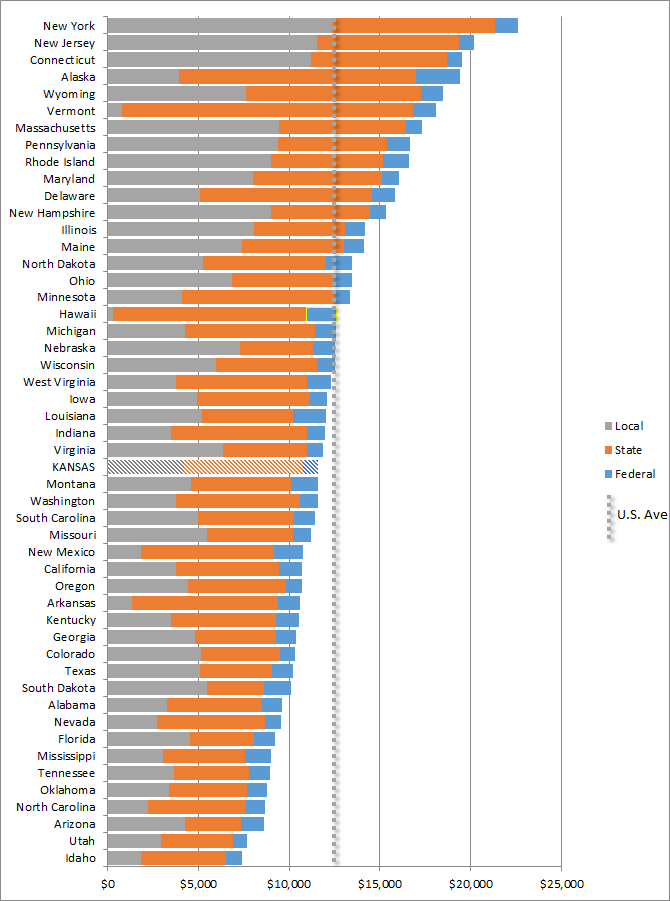
Those numbers are from the U.S. Census Bureau’s report Public Education Finance for 2012-13 school year, the most recent data available. (A new report for 2013-14 should be released later this spring.
This ranking includes not only state appropriations (what we think about as state aid), but also all local revenue sources, including property tax levies, student fees and local gifts and grants; and all federal aid, included education programs and student meal support.
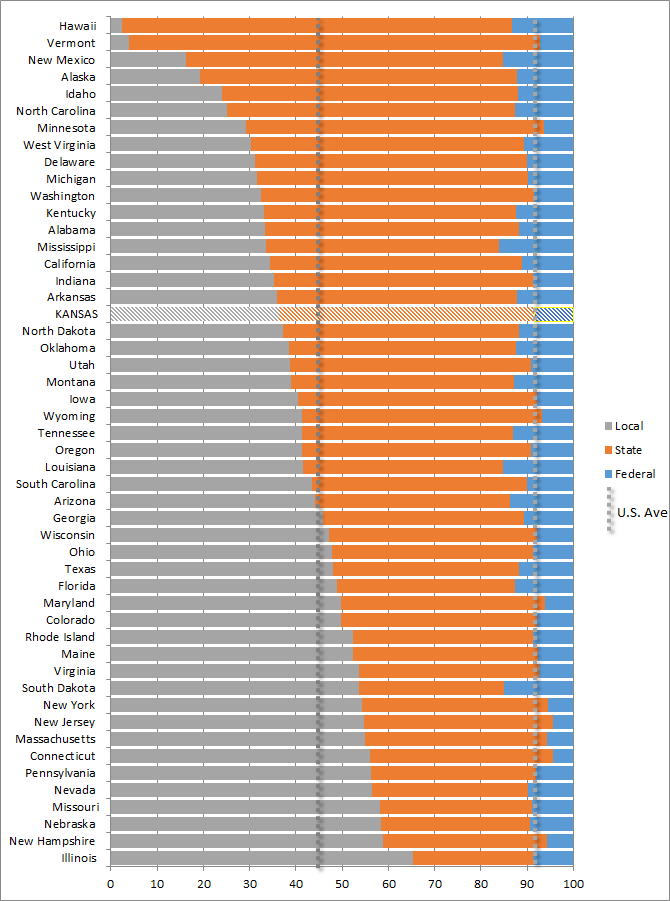
All School Revenues - Percent by State, Local and Federal
However, looking at the percent of education funding that comes from the state, rather than the amount, Kansas ranks 18th in the country. That is because since the early 1990s, the Kansas Legislature has chosen to rely more heavily on state funding rather than local funding to hold down property taxes and provide a more equalized funding system.
Education as Percentage of State Spending
A third way to measure state support for K-12 education is the portion of the state budget that goes to this function. It is this statistic, from the National Association of State Budget Officers, that shows Kansas ranking third.
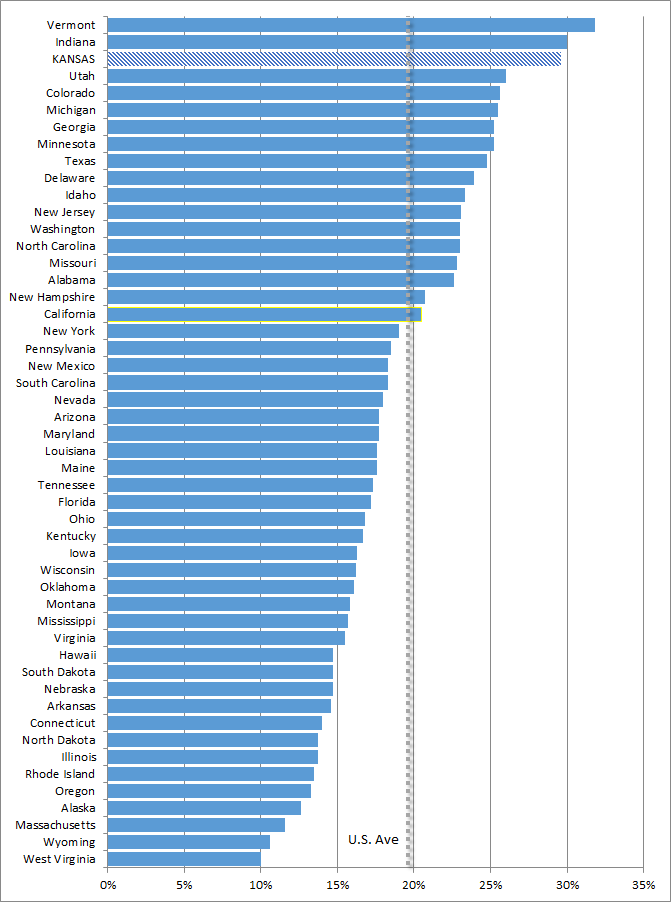
The percent of a state’s budget spent on K-12 education really does not provide much information on overall funding of education in that state. Among the top fives state on the chart above, Vermont ranks near the top in total funding (6th), Indiana and Kansas rank in the middle (25th and 27th, respectively) and Utah and Colorado rank near the bottom (49th and 38th).
An example of how the share of state budget spent on K-12 or the share of K-12 received from the state can have no impact on overall K-12 funding is illustrated by the way Kansas shifted the 20 mill statewide levy from a local source kept by local districts to a state source collected and then appropriated back to districts by the state. That switch did not change school funding at all, but was a major reason the share of Kansas’ total budget going to K-12 increased from 25.9 percent in 2014 in 29.6 percent in 2015.
Likewise, when the state increased local option budget state aid in 2015 in response to the Gannon decision in 2014, many districts that had reached their maximum LOB amount were required to reduce local property taxes, rather than increase spending.
Education Funding and Student Success
What about the most important aspect of K-12 education: student achievement? KASB has identified seven states that exceed Kansas on 14 national measures of achievement, including the National Assessment of Educational Progress reading and math tests all student, low income and non-low income students, ACT and SAT tests measuring college readiness, and graduation rates for all students and certain subgroups.
As the following chart shows, neither the percent of state budget spent on K-12 education nor the share of total K-12 funding from the state seems to have a major impact on high achieving states. However, each of the states spends more than Kansas and ranks in the top half of states for TOTAL funding. In other words, the amount of funding seems more important than the source of the funding.
States exceeding Kansas on 14 key achievement measures (and Kansas)
|
2015 Percent of State Expenditures for K-12 (and U.S. rank)
|
2013 Percent of total K-12 Expenditures from State Funding (and U.S. Rank)
|
2013 Total funding per Pupil (and U.S. Rank)
|
Nebraska
|
14.7% (40th)
|
32.1% (49th)
|
$12,514 (20th)
|
New Hampshire
|
20.7% (40th)
|
35.5% (50th)
|
$15,320 (12th)
|
Indiana
|
20.0% (2nd)
|
62.6% (9th)
|
$11,955 (25th)
|
Massachusetts
|
11.6% (48th)
|
40.2% (44th)
|
$17,315 (7th)
|
New Jersey
|
24.9% (12th)
|
38.7% (47th)
|
$20,191 (2nd)
|
Vermont
|
31.8% (1st)
|
76.2% (2nd)
|
$18,130 (6th)
|
Iowa
|
16.3% (32nd)
|
51.7% (24th)
|
$12,072 (23rd)
|
Kansas
|
29.6% (3rd)
|
56.4% (19th)
|
$11,596 (27th)
|