Friday, October 25, 2013

Setting the Record Straight on School Employees and Spending

I’ve been asked to comment on an ad that Americans for Prosperity has been running in recent months touching on several topics: the total amount of spending per pupil in Kansas (over $12,000 for the past five years), the share of that money going to teacher salaries, and claims over the past decade, for every two teachers, five “non-teaching” positions have been added.

A similar issue was raised by a state representative at the joint meeting between the State Board of Education and members of the House and Senate Education Committees, who said he was aware of a small district in Kansas had more “administrators” than “teachers.”  These comments reflect a theme that too little funding gets to “the classroom” to help students and teacher, and implies that schools are drowning in unnecessary bureaucracy.  What is the truth about these claims?

Instruction/Teachers vs. Administration/Bureaucrats

Let’s start with some definitions.  Discussions about “dollars in the classroom” usually rely on a federal reporting definition used by all districts and states for “instruction.”  This includes salaries and benefits for teachers and (importantly) teacher aides and paraprofessionals.  According to Kansas State Department of Education data, there were nearly 35,000 licensed teachers employed in Kansas districts last year, along with over 10,000 non-licensed aides and paraprofessionals. These individuals made up 65 percent  of the 68,568 total employees in Kansas school districts.  (Note: these are “full-time equivalent” or FTE positions.  Therefore, an employee who works only half a day would be counted as 0.5.  According to U.S. Census Bureau, the “head count” of school district employees is over 80,000.)

I suspect when people hear that “only” 65 percent of school employees are teachers or “instructional,” the implication is the other 35 percent really do not contribute to student learning.  In other words, if a school district employee isn’t a teacher, he or she must be an administrator or (even worse), a “bureaucrat.”  So what are these “non-teachers” doing?

The federal definitions include eight other major “functions” of education that support both students and teachers and provide for the management and operation of schools.  These include:

  • Student support - counselors, health services, psychologists, speech pathologists, social workers and school resource officers.
  • Instructional support - library and media center specialists and aides, technology support and curriculum support.
  • General Administration - superintendents and their central office staff.
  • School Administration - school building principals and their office staff.
  • Other Support Services - business managers, office staff.
  • Operations and Maintenance - utilities, insurance, custodial, security.
  • Transportation - bus drivers, vehicles and maintenance, fuel.
  • Food Service - cooks, food and food preparation.

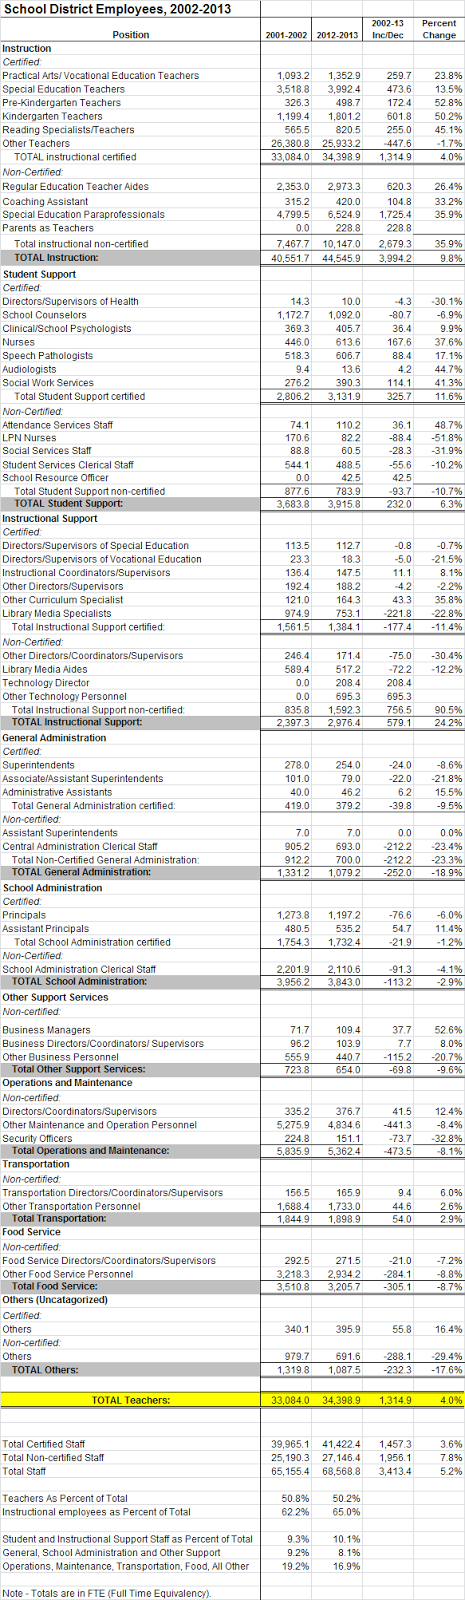
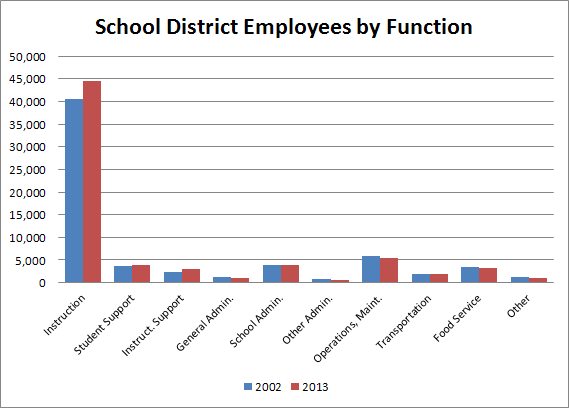
Instructional employees have been increasing; administrators decreasing.

KASB has been compiling data from the State Department of Education from over a decade.  Between 2002 and 2013, total school districts employees increased by nearly 3,400.  Actual teacher positions increased by 1,315, or 40% of the total, which seems to be what the AFP ad is referencing.  However, other instructional positions (classroom aides, special education paraprofessionals, Parents as Teachers staff) increased by 2,679 - which means the total increase in instructional “in the classroom” staff was GREATER than the total increase in district employees.

As the chart below shows, instruction (direct contact with students), student support (services to address student guidance, mental and physical health and social needs) and instructional support (direct support of classroom teachers) are the only areas of school district operations to increase staff over the past decade.  District and school level administration, operations and support staff, food service and all other areas have been reduced, and transportation staff has remained about the same.


The next chart, which shows the percentage of spending on each function, looks very similar.  This data includes not only salaries but all other expenditures, such as supplies, utilities, fuel, food, etc.  It does NOT include the costs of long-term equipment, building construction, repair and remodeling, and payments on bonds for new construction.


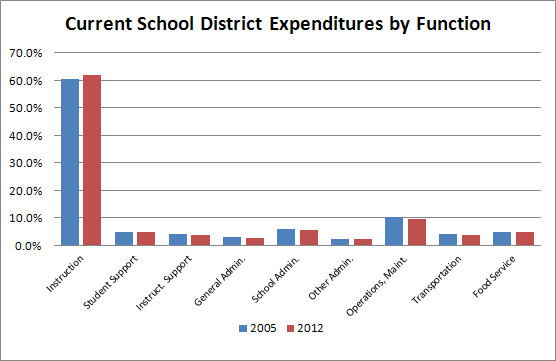
Both charts make clear that looking “only” at instructional or “in the classroom” expenditures ignores significant aspects of school operations.  Sixty-one percent of current operating expenditures goes to direct instruction.  Nearly 10% goes to direct services to students, families and teachers.  About 4% pays for transporting students to and from “the classroom” or activities.  Five percent is spent on school meals.  About 10% is spent to heat, cool, clean, insure, secure and maintain classrooms and other school facilities. Finally about 10% is spent on “administration” at all levels - which includes everything from overseeing the district to evaluating and directing staff to managing student discipline and engagement with parents and the community.

Is using about 10% of your employees to manage, supervise or “administer the other 90 percent unreasonable?  According to the 2012 Statistical Abstract of the United States, 11% of the national civilian workforce is employed in “Management, business, and financial operations” jobs, which means Kansas school districts basically reflect the national economy.

Frankly, if any of these “non-instructional” functions were significantly reduced, it would either mean fewer services for students or more duties and less support for teachers.

Kansas school employee distribution and spending decisions are serving students well.

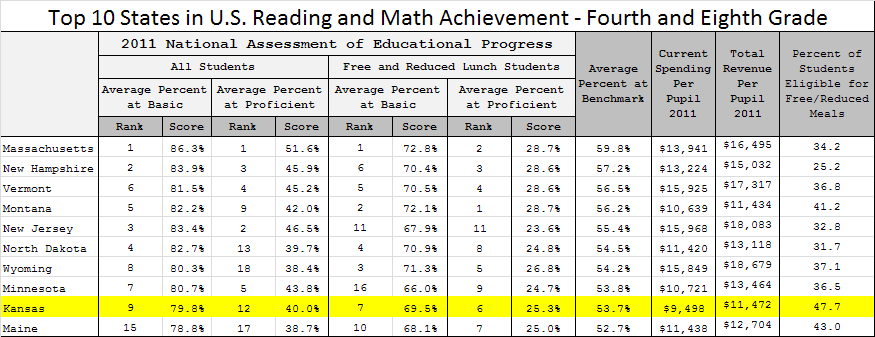
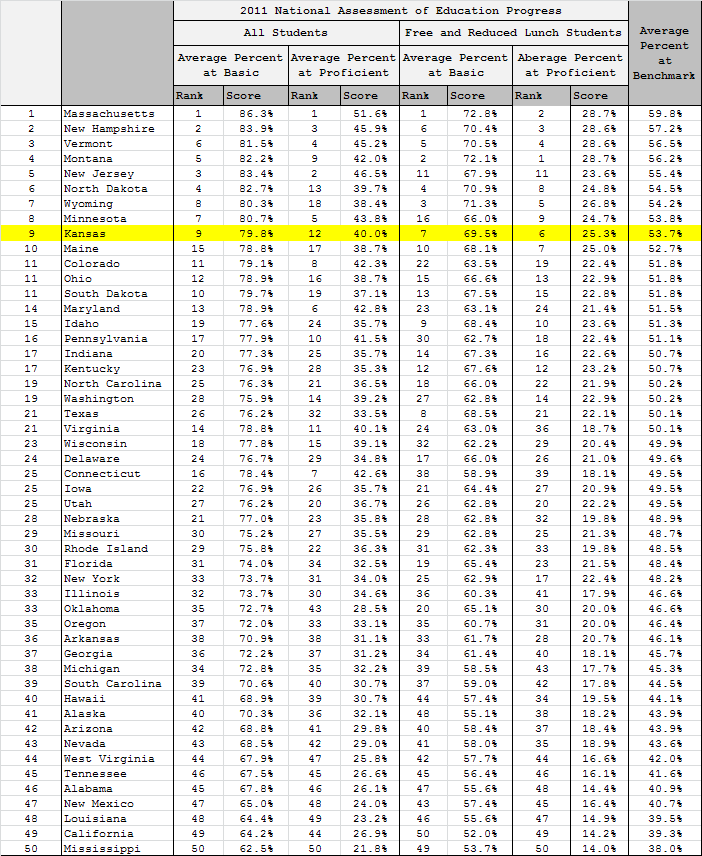
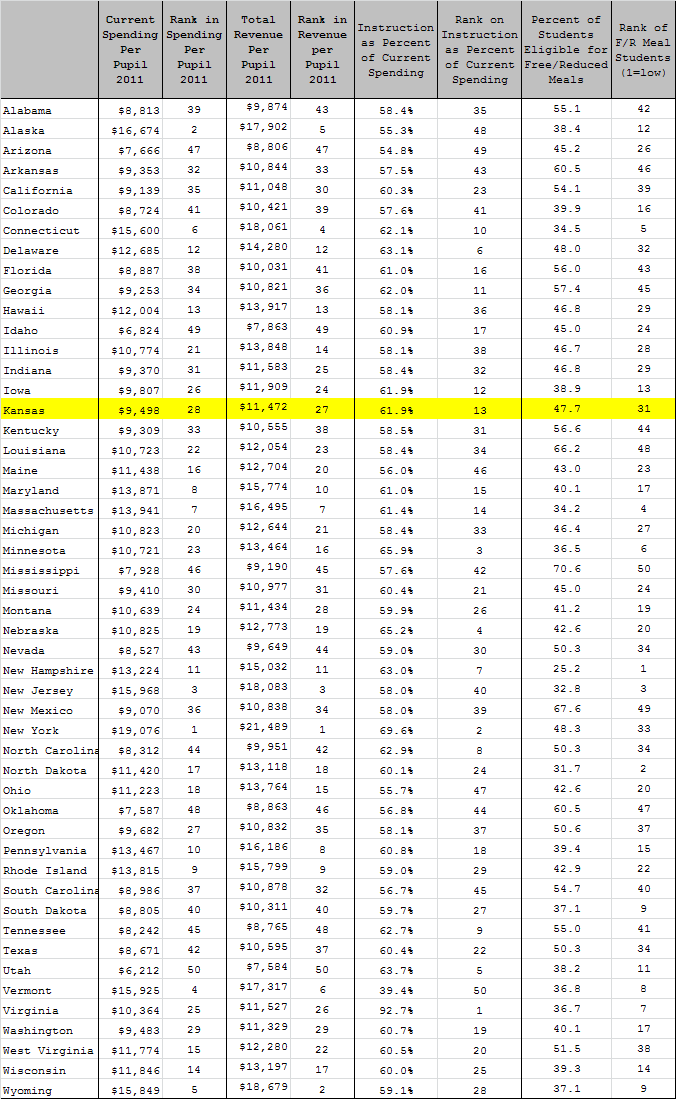
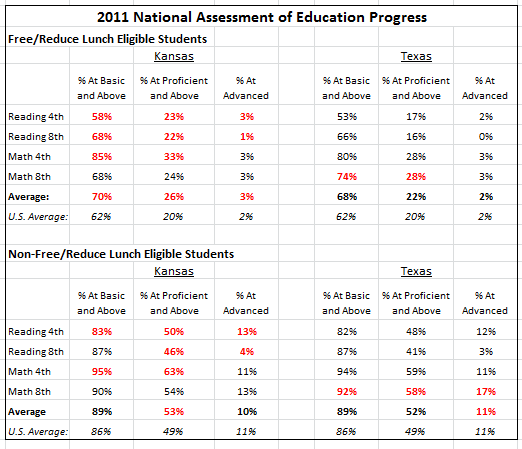
The AFP ad claims Kansas students are being short-changed by school spending decisions.  Let’s look at the data.  The federal government, which uses a slightly different way of calculating spending on instruction and current spending, reported that Kansas dedicated about 62% of current spending to instruction in 2011 - ranking 12th in the nation in the percent of current spending used for instruction - so Kansas actually ranked quite high in “dollars to the classroom.”

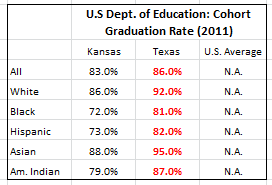
By most national measures of state performance (test scores, graduation rates, college preparation and completion), Kansas also ranked among or near the top ten states.  However, our current spending per pupil ranked 27th in the nation and instructional spending per pupil ranked 26th, so Kansas is clearly achieving very high results compared to its level of spending.  As we have previously noted, on almost every measure, the few states with higher achievement than Kansas spent more per pupil and had far fewer at-risk, low income students.

In other words, far from being “short-changed,” Kansas students get better results than about four-fifths of the other states, even though more than half of the states spend more per pupil than Kansas, and more than half the states have a lower percentage of low income students.  In fact, there is no evidence that spending a higher percentage of current resources on “instruction” would provide better results.  KASB compared instructional spending as a percent of current spending with state results on national math and reading tests at fourth and eighth grade, and found a small negative relationship between two.  That means states spending a higher percentage on instruction were slightly less likely to have higher student achievement.  (KASB analysis of national data comes from the National Assessment of Educational Progress for reading and math, and Public Education Finances: 2011).

Which brings us to the final point.  Schools are often accused of failing to operate like a business.  Yet what analysis of business operations would begin (and end) with the share of spending going to a particular segment of the workforce, rather than looking at results?  For some critics of public education, the implication is that local school board members are incapable of making good decisions about how to allocate resources and staff - despite the fact that Kansas schools continue to deliver “top ten” results while spending less than most states and educating a higher percentage of income students than more states.

It’s up to school leaders to change that perception.  You can share with Legislators, parents and the public the real data about your school district’s employees and how you spend your money.  This page on the KSDE website takes you to a number of KSDE reports.  Clicking on “personnel” allows you to access spreadsheets listing the Certified and Noncertified employees in each district, for school years 2008-09 through 2012-13.  This page allows you to access information on the current operating expenditures for the entire state and each district for 2011-12, and previous years back to 2004-05.

Of course, the KASB research department can help you access this information and prepare customized reports for your districts.

The chart below shows the statewide change between 2002 and 2003 for all categories of school district employees, grouped by school district budget “function.”


Friday, October 11, 2013

National Reading, Math Tests Show Higher Achieving States Spend More Per Pupil than Kansas

One of the most important debates about educational achievement is the role of funding. This week, the Kansas Supreme Court heard arguments in the Gannon case. The plaintiffs argue that the state is failing to meet its constitutional obligation to “provide suitable finance for the education interests of the state” because funding levels have been reduced or have not kept up with costs. The defense says that Kansas student achievement is quite high, suggesting overall funding levels are adequate. Others argue Kansas doesn’t need to spend more money on education because higher funding doesn’t result in better outcomes.


To test these contentions, KASB studied the results of the 2011 National Assessment of Educational Progress (NAEP) and other state data from the National Center for Education Statistics.  Here’s what we found: higher achieving states almost always spend more than Kansas and there is a positive statistical correlations between higher spending and better results.  These results follow an earlier study that showed states with higher spending have higher college readiness results on the ACT test.


The NAEP is given to a sampling of students in all 50 states every two years. (This allows state scores to be reported but not individual district or student scores.)  Students are tested in reading and math at grades four and eight.  In addition to an average “scale score” in each state, NAEP also reports the percentage of students scoring at certain benchmark levels: Below Basic, Basic, Proficient and Advanced.


KASB research has shown that the percentage scoring at Basic is a good indicator of the state’s graduation rate, i.e. the percentage of students who complete high school.  The percentage scoring at Proficient is a rough indicator of the percentage of students who will meet college readiness benchmarks on the ACT test.  In other words, the percent at Basic might be considered the percentage of student “on track” to graduate, and the percent at Proficient indicates those “on track” to be ready for college-level academics.

Kansas ranks among top performing states


To measure overall state performance, we calculate the average of the percentage of students scoring at both Basic and Proficient on the four tests (Grade 4 reading and math; Grade 8 reading and math).  We then rank the average percent for each state.  The results are shown in Table I near the end of this story.
Eight states top the nation with average scores of 80% or higher at Basic for all students.  Kansas is just outside this group, ranking 9th at 79.8%.  Ten states rank at the bottom with scores below 70%.  Likewise, 12 states top the nation with 40% or more students scoring at Proficient or higher, including Kansas.  Nine states have less than 30% at Proficient.


As explained in an earlier post, lower income students usually score much lower than upper income students.  To see how states perform in educating their lower income at-risk students, we used the same approach to average the percentage of students eligible for free or reduced lunch who score at Basic and Proficient on the four tests.  The percentage of low income students meeting these benchmarks is generally about 10 points or more lower than all students.


Six states have 70% or more low income students at Basic, with Kansas ranking 7th at 69.5%. Thirteen states have less than 50% of low income students at Basic.  Seven states have at least 25% of low income students at Proficient, including Kansas (6th at 25.3%).  Ten states have fewer than 18% of low income students at Proficient.


Averaging these four state percentages (all students at Basic and Proficient, low income students at Basic and Proficient), Kansas ranks 9th (53.7% average percent at benchmark).  It’s clear that Kansas ranks among or just below the highest achieving states in the nation, both for all students and specifically for low income students.  What are we spending to get those results?


Using the most recent national data (for the 2010-11 school year), Kansas ranked 27th in total revenue per pupil at $11,472.  (Total revenue includes ALL school districts revenue from state, federal and local sources.)  Kansas ranked 28th in the nation in current spending per pupil at $9,498 (Current spending excludes long term expenditures such as buildings and equipment, payments on loans and pension costs.)  Kansas also had a fairly high percentage of low income students: 47.7%, compared to the national average of 48.1%.  In fact, 30 states have a lower percentage of low income students than Kansas.

National Test Results and Education Spending

At first glance, this data would seem to support the state’s claims in the Gannon lawsuit. Kansas schools are producing very high results compared to other states, while spending below the national average. Kansas also ranks very high even though most states have fewer low income, at-risk students. In fact, Kansas ranks even higher for low income students than it does for all students. Do our own achievement results indicate current funding is “suitable?” It would seem to depend on whether the status quo is acceptable or “suitable.” The Kansas Constitution mandates a system of public schools for “intellectual, educational, vocational and scientific improvement,” which the Supreme Court has said indicates the status quo is never good enough, because the people have mandated continuing improvement.

Even if the constitution itself doesn’t mandate improvement, the constitutionally elected State Board of Education has continued to set higher standards. Most critics of Kansas public schools claim educational achievement falls short of the mark. Economic data indicates Kansas must increase the percentage of high school graduates and college-ready students to meet future employment needs and provide “middle class” incomes. In addition, the testing and funding data presented above is several years old, and new national reports have indicated Kansas has further reduced spending compared to most other states.


If the question is not what it costs to achieve current results but what it costs to achieve even higher results, here are some key facts to consider.


  • With just two exceptions, every state with a higher percentage of all students and low income students meeting Basic or Proficient benchmarks spent more per pupil than Kansas in 2011.


  • Colorado, which had both lower current spending and total revenues per pupil than Kansas, ranked higher on just one benchmark (all students at Proficient).  Montana had over $1,000 higher current spending per pupil than Kansas, but just slightly lower total revenue per pupil ($38, or 0.3%).


  • Both Colorado and Montana had far fewer low income students than Kansas.  Colorado had 39.9% and Montana 41.2% students eligible for free and reduced meals, compared to 47.7% in Kansas.  Colorado also had much lower achievement for low income students, ranking 22nd at Basic and 19th at Proficient - about 15 spots lower than Kansas.


KASB also looked at the statistical correlation between spending per pupil in each state and the percentage of students at NAEP benchmarks.  In each case, we found a positive correlation as follows:


Although there is no hard and fast rule for the strength of statistical correlation, many sources suggest that a positive correlation of 0.4 and above is a moderate to strong relationship, and that a correlation of 0.3 is a moderate relationship.  Even a correlation above 0.2 indicates at least some relationship.


The totality of the evidence indicates that funding does play an important role in state student achievement and that it will be extremely difficult - and, in fact, unprecedented - for Kansas to improve achievement on NAEP results without additional revenues.


Table I


Table II:


Monday, October 7, 2013

A Deeper Look at Student Achievement: Kansas, Texas and the U.S.

Wichita blogger Bob Weeks has an interesting post and video that makes several points about evaluating educational performance.  First, it is important to consider characteristics of the student population which can have an impact on results.  Second, it is important to consider as much data as possible to see the full picture.


Mr. Weeks reviews the results of the 2011 National Assessment of Educational Progress for Kansas and Texas.  The NAEP tests a sampling of students in each state at grades four and eight in reading and math every two years.  Overall, Kansas students score higher on the NAEP than those in Texas.  Kansas spends more per pupil than Texas, and KASB has compiled evidence that both nationally and regionally, states with the best achievement on a variety to educational achievement factors tend to spend more per pupil than states with lower achievement.


However, Mr. Weeks points out that Texas actually has higher “scale scores” than Kansas for racial or ethnic “subgroups” on most tests. Like Kansas and other states, Texas has a “significant achievement gap” among these groups, with non-white students usually performing at lower levels than white students.


“In Kansas, 69 percent of students are white,” he writes.  “In Texas it’s 33 percent. This large difference in the composition of students is what makes it look like Kansas students perform better on the NAEP than Texas students.  But looking at the scores for ethnic subgroups, which state would you say has the most desirable set of NAEP scores?”


These results raise important questions about student achievement.  Texas spends less per pupil than Kansas - but Kansas also spends less than the national average. We wanted to dig deeper into student characteristics and educational outcomes in comparing Kansas and Texas to each other and the nation as a whole.


Factors OUTSIDE of school have a big impact on achievement IN school


To begin with, KASB absolutely agrees that differences in student characteristics must be considered in evaluating educational performance.  I made exactly the same point in my August 14, 2013 blog post "Celebrating Back to School Success" when I noted that student performance for all student subgroups, especially minority students, has been growing faster than the overall average, because minority students compose a growing portion of the U.S. and Kansas population.  When critics says student performance hasn’t improved very much, they rarely note that overall performance would be much higher if the student population was the same as in 1970, 1985 or even 2000.


However, the most important factor in student performance isn’t race or ethnicity, but socio-economic status.  As a group, lower-income students, usually measured by eligibility for free or reduced lunch, have much lower performance than middle- and upper-income students.  Non-white students also tend to lag behind - because they are more likely to be from low income families.


Studies have shown for decades that lower income students lag behind their peers.  There are many reasons.  Lower income parents tend to have lower education levels themselves, and may provide less academic support at home.  Low income children are exposed to a much smaller vocabulary.  Low income students are more at-risk for deficiencies in basic needs, like food, health care and even shelter.  Parents in lower income families are more likely to be absent, neglectful, substance abusers or incarcerated.  Children in these circumstances simply face more distractions from academics than more affluent children from stable homes and better educated parents who promote education.


These factors have nothing to do with race.  Economically advantaged minority students can be just as successful as white students. Likewise, lower-income white students also struggle academically.


While Kansas and Texas students are considerably different in racial make-up, they are surprisingly similar in terms of socioeconomic status. As noted above, 68 percent of Kansas students were white in 2010-11, compared to just 31.2 percent of Texas students.  However, 47.7 percent of Kansas students were eligible for free or reduced lunch, compared to 50.3 percent of Texas students.  In other words, only 2.6 percent more Texas students are low income than Kansas students. Both were close to the national average of 48.1 percent.  And although it was not noted in Mr. Weeks’ blog, Kansas low income students AND non-low income students have higher NAEP scores than Texas.


Kansas usually exceeds Texas on NAEP scores when considering family income


Rather than looking only at “scale scores,” we examined the percentage of students scoring at each of the three main achievement levels reported by NAEP: basic, proficient and advanced.  We have found that a score of “basic” is a fairly good indicator that the student is on track to graduate from high school, while “proficient” is a rough predictor of college readiness on ACT or SAT tests.


As the chart below indicates, low income Kansas students did better on eight of the twelve tests; Texas students did better on two, and two were a tie.  (The higher score is in red.)  In both states, low income students made up about half of the student population.  For higher income students, Kansas had better results on seven of the twelve tests, Texas on three, and two were tied.


However, NAEP tests are only one measure of student achievement, and the highest level tested is eighth grade.  Since few students will be successful based only on eighth grade knowledge and skills, we wanted to look at how Kansas and Texas do preparing students for success after high school.


Kansas and Texas Graduation Rates


We started with high school graduation and dropout rates from the following sources: the 2013 Diplomas Count report, the Digest of Education Statistics table 125 (public high school graduates and graduation rates by state), the Digest of Education Statistics table 126 (the number and percentage of grades 9-12 dropouts by state), the Digest of Education Statistics table 13 (percentage of persons age 18-24 who were high school completers), and U.S. Department of Education adjusted cohort graduation rate for 2011.


The first report is the respected “Diplomas Count” annual survey of four-year graduation rates (students who achieve a high school diploma within four years of beginning ninth grade).  It shows Kansas graduating roughly 10 percent more students than Texas as a whole, with better results in every major subgroup except Hispanics.  Kansas also exceeds the national average for every group except Hispanics and all students.


The second report is from the most recent “Digest of Education Statistics” from the U.S. Department of Education. Unlike “Diploma Count,” this report shows Kansas significantly higher than the national average for all students, including Hispanics.  It also shows Texas with a better graduation rate than Kansas for Blacks and Asians.  (In a likely data error, it shows a 100 percent graduation rate for Native Americans, which is contradicted by the next report on the dropout rate from the same source.)


The Digest of Education Statistics also reports on each state’s dropout rate, which is a different calculation than the graduation rate.  It is the number of students who drop out anytime during grades nine through twelve, divided by the total number of ninth through twelfth-graders.  This report shows Kansas with a lower (better) dropout rate for all students, as well as Blacks, Hispanics and Asians, while Texas has a lower rate for Whites and American Indians.


However, a different calculation for high school graduates was released last year by the U.S. Department of Education for the class of 2011, which is a year later than the other data.  This new report shows Texas topping Kansas for every group, and reports Texas has much higher rates than any other study.  It will take some time to determine whether Texas actually made significant improvements between 2010 and 2011, or if there is some different methodology that produces significantly different results.


This means we have three different national reports on the graduation rate for students within four years of ninth grade that give significantly different results.


The final report on high school completion also comes from the Digest of Education Statistics.  Unlike the other data, which looks at graduates and dropouts as a percentage of the high school class or population, this report measures the percentage of persons in the entire population aged 18 to 24 who have received a high school diploma or the equivalent.  Essentially, this captures young adults who did not complete high school “on time,” but have received a secondary school credential within five years of “normal” graduation age through an alternative program.  Kansas leads both Texas and the national average.  Unfortunately, this data does not include subgroups.


Although this data is frustratingly mixed, it should be noted that Kansas exceeds the national average on every report where a national average is given except one.  Yet Kansas is very close to the national average in low income students - in fact, 30 states have had a lower percentage of free and reduced lunch eligible students in 2011, including every state in the region except for Texas and Oklahoma.


Texas is below the U.S. Average on SAT scores; Kansas tops U.S. on ACT


Finally, we want to look at how well students are prepared for college.  Unfortunately, direct comparisons between Kansas and Texas are not possible because most Kansas high school graduates take the ACT and most Texas graduates take the SAT.  However, we can compare both states to the national average of their majority test.


The 2013 SAT results for the graduating class of 2013 were just released.  The only Texas groups that exceed the national SAT average were Whites and Blacks in math, and Asians in reading.  None of the total group scores for Texas exceed the national average.  (We are only listing results for groups that included at least 5 percent of the group tested.  Note also that SAT allows students to identify as “Mexican or Mexican-American,” or as “Hispanic, Latino or Latin American.”)


The ACT testing program reports not only mean scores of tests, but reports the percentage of students whose scores indicate a strong likelihood of completing college-level work in that subject.   As the table below shows, all Kansas students and every subgroup except Asians exceed the U.S. average in every subject.  Kansas Hispanics tied the U.S. average for meeting all four subject benchmarks.


In 2013, ACT reports 75 percent of Kansas high school graduates took the ACT.  Although SAT does not report the percentage tested by state, the number of Texas students tested would equal 59 percent of estimated high school graduates using the same source as the ACT.  Generally, a higher percentage of students tested lowers than the overall state performance (because the higher number includes more students with less ability, preparation or motivation).  However, Kansas does much better compared to the national average of its primary college aptitude test than Texas, despite testing a higher percentage of students.


These results show the limitations of reliance on any single measure of educational performance.  Mr. Weeks’ blog stressed the importance of looking beyond single indicators.  It is clear that Texas does better than Kansas on the NAEP when considering racial and ethnic subgroups, but Kansas does better educating low income students.  Measures of high school completion are also mixed, but Kansas does better for all students and a majority of subgroups on three out of four national reports.  However, Kansas clearly does better in college preparation when compared to the national average on its primary test for all students and most subgroups, while Texas does worse than the national average for the SAT for all groups and for subjects tested.


Both Kansas and Texas spent below the national average per pupil in 2011.  According to the National Center for Education Statistics, Kansas ranked 27th in total revenue per pupil at $11,427.  Texas ranked 37th, spending about $900 less.  Based on the totality of student performance, which state is getting the best results?