Thursday, October 27, 2016

How do school district administrative costs compare to the private sector?

A recent report from the Harvard Business Review found that managers and administrators made up 17.6 percent of the U.S. workforce and received nearly 30 percent of total compensation, which works out to one manager and administrator for every 4.7 employees. The report suggested the U.S. economy could function more efficiently with one manager for over 10 employees.


Out of 68,372 school district positions last year, 4,096 were superintendents, assistant superintendents, principals, assistant principals, managers or directors. These management positions are 6.0 percent of the total school district workforce, or one manager for every 16.7 employees. In other words, school managers supervise almost four times as many employees as managers in the overall workforce.


According to the Bureau of Labor Statistics, the average pay for a chief executive officer in Kansas (both public and private organizations) last year was $185,850. The average salary for a Kansas school superintendent that year was $102,238. The average salary for superintendents in large districts (more than 5,000 students) last year was $174,921. (As in the private sector, executives of larger organizations tend to make substantially more.) KASB Report


Follow-up: Some say certain superintendents or administrators make $500,000 to $600,000 per year.


The highest salary reported to KASB for last year was $239,000. Reports featuring these larger amounts appear to be cases where superintendents received a one-time retention bonus based on longevity. School boards negotiate these contracts to reward administrators who stay in the district, using the same logic to retain talented managers as the private sector. KASB Report

It is also important to differentiate between salary and benefits. The amounts for board paid fringe benefits can vary based on what kinds of benefits were agreed upon in the superintendent’s contract. The average amount reported for board paid fringe benefits for superintendents last year was $10,615, but values ranged from less than $1,000 to over $100,000.  KASB Report

Have school districts hired more educators or administrators in recent years?

Out of nearly 8,000 school district positions added since 1998, 7,266 (82.8 percent) have been what a legislative study committee identified as “direct educators”; 1,171 (13.3 percent) have been positions not directly connected to instruction, such as bus drivers; and 341 (3.9 percent) have been in “core support,” which includes staff of central administrative offices (not necessarily superintendents and principals.) KASB report.


Since 1998, the number of superintendents has decreased by 27 (9.3 percent) and the number of principals dropped 76 (6.0 percent). The number of students, teachers and other support staff have increased, which means individual superintendents and principals are responsible for supervision and evaluation of more students and staff. KASB report.

Wednesday, October 26, 2016

What do school districts do with more (or less) money?

About 85 percent of school funding goes to school district salaries and benefits or to contracts for services that employ others receiving salaries and benefits. When operating funding increases, it generally goes to provide competitive salaries and benefits and to hire more people to provide additional services. KASB report.


From 2000 to 2005, total school employees increased by over 524 positions; from 2005 to 2019, employment increased an additional 6,415 following the Montoy funding, and as funding has fallen behind inflation since 2009, school district employment decreased by 1,719. KASB data tool.


Most of the rest of the funding increases in recent years have been for improving school district facilities for increased enrollment, expanded programs, energy efficiency, safety features and new technology.


Follow-up: Some say school districts have hired far more non-teachers than teachers in recent years. Is that true?

That is only true if not counting individuals who assist teachers in the classroom, but are not fully licensed teachers, such as special education paraprofessionals and regular classroom aides. Districts have hired more of these positions because licensed teachers may not be available, or because it is more efficient to hire these individuals to take over routine duties from regular teachers.

Tuesday, October 25, 2016

How has school funding changed compared to inflation and other cost indicators?


Since 2000, school funding increased somewhat more than inflation before the Supreme Court Montoy decision in 2005; increased significantly for four years as the Legislature responded to that decision which said school funding was too low; and has averaged less than inflation since the Great Recession in 2008-09.


From 2000 to 2005, total expenditures per pupil (using the full-time equivalent enrollment that does not count full-time kindergartners and district-funded preschoolers) increased an average of 2.0 percent more than inflation per year.


Looking only at general fund, special education state aid and local option budgets, spending per pupil increased just one-quarter of one percent more than inflation. (Total expenditures include building construction costs and payment of debt for construction bonds, as well as KPERS pension contributions, federal funds, food service and fees that are not included in general fund, special ed and LOB.)


From 2005 to 2009, following the Supreme Court order to increase K-12 funding after the Montoy decision, total funding increased an average of 4.5 percent per year more than inflation. General fund, special ed and LOB spending increased almost 5.0 percent more. During the period, the Legislature substantially increased funding for at-risk, bilingual and special education students, and increased local option budget authority.


From 2009 to 2016, total per pupil funding has decreased an average of 1.23 percent per year after adjusting for inflation. General fund, special ed and LOB funding decreased almost 2.0 percent more.  As a result, when adjusted for inflation to 2015 dollars, school funding is below 2009 levels, although unadjusted dollars are higher.


Follow-up: Some say because school funding is higher than inflation if you count increases in the 2000s, school districts should have enough money to operate.


School district costs are rising faster than inflation. From 2000 through 2015, the U.S. Employment Cost Index (a measure of changes of salaries and benefits for all public and private sector employees) increased an average of 0.5 percent more than inflation. From 2005 through 2015, the U.S. School Building Cost Index increased more than 2 percent more than inflation (this measure has only been available since 2005).

In addition, the needs of students have changed. There are far more low income students, who have less family support; bilingual students, who need special assistance in other languages; and students with severe physical and emotional needs, who need high cost specialized services.

Monday, October 24, 2016

Key Facts: How have Kansas school district spending choices changed?

School districts have directed more operating dollars to teaching and to programs helping students, and reduced the percentage of operating spending on almost everything else. The total dollars available for operating costs are limited by the state and federal government. Capital expenditures for buildings and payments for school construction bonds, which are approved by local voters, have been increases more than operating costs.


According to data from the Kansas State Department of Education, in 2015 school districts spent 61.4 percent of operating funds on direct instruction (teachers, special education paraprofessionals, classroom aides, coaches and classroom materials), up from 56.7 percent 15 years ago.


Districts spent 5.4 percent of operating funds on student support programs (such as counselors, nurses, attendance officers, social workers and school psychologists); up from 5.1 percent in 2000, and 4.0 percent on teacher support (libraries, media centers and professional development); the same percent as in 2000.


Spending on school administration (principals and school office personnel) dropped from 6.2 percent to 5.5 percent. Central administration costs are 5.1 percent of operating costs, down from 5.4 percent.


Operations and maintenance costs, which include utilities, insurance, custodial services and security, make up 9.6 percent of operating expenditures, down from 11.1 percent. Transportation costs for students to and from school and activities is 4.3 percent, down from 5.4 percent. Non-instructional spending, which is mostly food service programs (breakfast and lunch) is 4.7 percent, down from 6.1 percent.


Operating expenditures dropped from 91.7 percent of total expenditures to 88.0 percent. This is primarily because local voters have approved school construction bonds at a faster rate than the Legislature has approved increases in general operating aid and local option budgets (which are limited by the state). Local boards and voters cannot shift funding from building and equipment funds to operating funds.


Follow-up: Some say only about half of student spending actually “gets to the classroom.”

That’s only true if you accept the idea that “instruction” is the only thing that matters “in the classroom.” However, student learning in the classroom would not be possible without the other areas of the budget - including buildings and operating the classroom, supervising and supporting teachers, and transporting, feeding and providing support services for students.

Friday, October 21, 2016

New study finds Kansas funding falling behind highest achieving states

A new study of K-12 education funding in the United States finds that Kansas had the eighth largest cut in per pupil funding between 2008 and 2014.

Only 14 states increased funding over that time after adjusting for inflation, and all nine states that outperform Kansas on KASB’s State Education Report Card are in that group. This means the nine highest performing states in the nation are all among the 14 states that increased per pupil spending the most since the Great Recession began in 2008.


KASB’s report card ranks states on 15 indicators of student success, including national test scores, graduation rates and postsecondary preparation, participation and completion, for students and subgroups. Only nine states have a higher overall ranking than Kansas. KASB identifies these as “aspiration states” because they exceed Kansas on overall education outcomes.

All nine aspiration states spend more per pupil than Kansas, and all nine increased state and local funding more than inflation since 2008, according to the study from the Center for Budget and Policy Priorities, a national think tank.

The CBPP study found Kansas per pupil funding declined by 14.2 percent since 2008 after adjusting for inflation. According to the KASB data from the Kansas State Department of Education, unadjusted per pupil funding in Kansas is higher than 2008, but those increases have been less than the total increase in the consumer price index over that period.

KASB’s education report card contains similar data, but does not adjust for inflation. It found that the “aspiration states” increased total funding for pupil much more than Kansas since 2008.

The report card found that although Kansas continues to rank high in achievement, has not been improving as fast as most other states on education measures over the past decade. Although most Kansas educational outcomes have improved, they have not improved as much as many other states. Over the same period, although Kansas school funding has increased in dollar amounts, it has not increased as much as most other states.

The CBPP report confirms these school funding trends, showing that Kansas per pupil funding has fallen behind both inflation and most other states.

Because jobs and income levels are increasingly linked to education levels, state with the best educational outcomes are likely to have the best economic outcomes. The data shows that the highest achieving states are also among the states that have invested in most in education.

Thursday, October 20, 2016

Key Facts: What determines the level of school district cash reserves?

A new report from the Kansas State Department of Education shows school district ending balances for operating funds increased $50 million over last year. Why would district balances increase at a time many school leaders believe they are being underfunded? In other words, why put more money in the bank if you believe you aren’t able to spend enough on student programs, teacher salaries and other needs?


A closer look shows that school district cash reserves are reasonable for the state’s fiscal condition and other factors. Here are eight facts about district cash balances or reserves.


First, delayed state aid payments distort actual cash balances.


It’s important to recognize that the July 1 ending balance report is inflated every year because of delayed state aid payments. Since 2003, the state of Kansas has regularly delayed paying a portion of the final state aid installment of the fiscal year ending June 30 until some time in July.


By law, school districts are required to account for the money as having been received in June, but do not actually get the money until sometime in early July. That means the July 1 ending balance report is always inflated, usually by around $200 million. Last June (2015), the delay was $193 million.


This June (2016), with state tax revenues running far behind expectations, the delayed payment was increased to $260 million. Therefore, while the July 1 balances in district operating funds are about $50 million more than last year, the amount of money delayed (and not yet actually received by districts on July 1) is $75 million more than the previous year.


Second, some districts increased reserves in June because of fear that districts would not receive funding in July.


This June was a unique situation as Kansas school faced a possible shut-down order due to the Gannon school finance case. Without timely action by the Legislature, funding after July 1 could have been blocked by the Supreme Court. Districts may have delayed expenditures that normally fall in June or added to reserves to try to fund essential maintenance services during a shut-down.


Third, a big part of operating reserves really aren’t for regular operations.


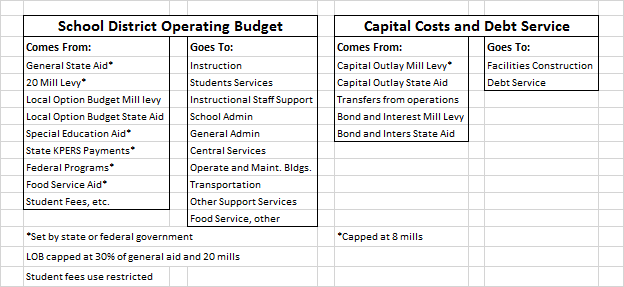
Total school operating fund reserves, which exclude funds for capital outlay, bond payments and small revenues from certain local mill levies, are $920.9 million this year. However, that amount does include $242.3 million in funds restricted from general operating purposes.


These funds include $24.4 million in federal funds, which must be spent on specific purposes; $35.5 million in gifts and grants, which are usually restricted by the donor, such as for scholarships; $117.9 million for district insurance reserves; and $64 million for textbook and material purchases. Almost one-third of the $75 million increase was in federal funds, in part due to a change in the schedule of federal impact aid.


Fourth, cash balances are appropriate for the state’s financial climate.


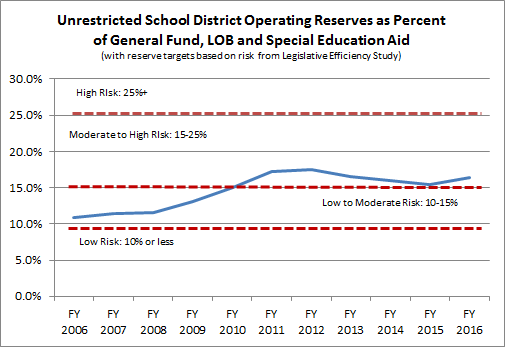
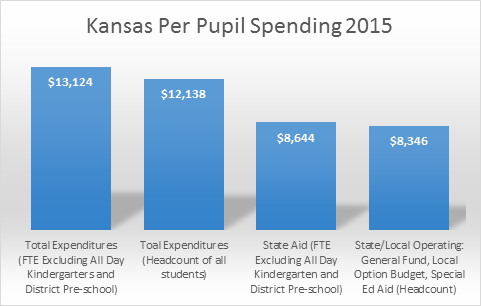
When these restricted funds are subtracted, the remaining balance of about $680 million equals approximately 16 percent of school district operating budgets (general fund, local option budgets and special education state aid), or about two month’s operating costs, or about 1 percent more than last year.


The Legislature’s own efficiency report from last session cites the Government Finance Officers Association (GFOA) recommendation that school districts maintain a balance of between 10 percent and 15 percent for “low to moderate risk” conditions; between 15 percent and 25 percent for “moderate to high risk;” and greater than 25 percent for “high risk.” On average, Kansas school boards - who approved budgets that include cash reserves - appear to believe the Kansas fiscal situation is at least “moderately” risky, given years of revenue shortfalls, credit downgrades, budget reductions and disappearing ending balances.


Cash reserves were slightly over 10 percent in 2006; increased to about 18 percent during and following the Great Recession; and have been declining since 2012 - until this year.


Fifth, many school leaders believe the state fiscal situation is at a higher level of risk.


The additional $75 million in payments was delayed to avoid a state general fund deficit. That comes on top of nearly $100 million in delayed school district aid for the Kansas Public Employees Retirement System. The state general fund has essentially no projected reserves. Some districts added to their reserves in anticipation of possible state funding cuts during the current school year if state tax revenues continue to lag.


Sixth, school district bond ratings are based in part on district reserves.


District bond advisers encourage districts to keep balances at levels recommended for financial, rather than political, reasons, which saves local and state taxpayers interest costs.


Seventh, district balances are high in July to provide cash flow for the rest of the year.


School district revenues and expenditures do not happen in tandem. For example, school districts had almost $200 million in special education balances last July 1, but that dropped below $60 million by March as special education costs outpaced special education state aid.


Eighth, like school districts, the State of Kansas cannot operate with reserves.


Although the state of Kansas frequently ignores its own 7.5 percent ending balance requirement for the state general fund, it is forced to borrow from other state funds through “certificates of indebtedness” to manage its own cash flow needs. The combination of ending balance and internal borrowing since 2007 has consistently been around 15 percent or higher.


The state’s borrowing would need to be even higher if not for the $200 million or more delay in school district aid payments. In other words, school district reserves help the state manage its own cash flow.


As these reasons explain, school district cash balances are determined by a number of factors, but there are rational, fiscally sound reasons for the way districts have been managing them.

Wednesday, October 19, 2016

Key Facts: How is school district funding determined and spent?

School spending is divided into two areas. The first, general operating expenditures, go to salaries, utilities and materials. The total amount of these funds is mostly limited by the state and federal governments, however, local boards decide how to spend what they receive.


The second, capital expenditures and debt payments go to acquire, build and equip facilities and pay for constructional bonds. The amount of these funds are mostly controlled by local school boards and voters. However, these funds can only be used for building costs and limited use for building maintenance.


As noted in the chart, most operating funds are set by the state or are based on federal appropriations. Districts may adopt a local option budget for operations, but the amount is capped at 30 percent of the general fund, which is set by the state Legislature (or 33 percent if the district holds an election).

Follow-up: Why do school districts spend money on buildings and other facilities when they are concerned about operating costs?

The amount of funding for general operating costs is set by the state. Many districts have reached the state imposed limit on what they can raise for local option budgets. However, districts can raise up to eight mills in local property taxes for building construction, upkeep and maintenance; and there is no limit on what local voters can approve for construction bonds. The dollars raised for facilities cannot be used for most salaries and operations even if the board would prefer.

Tuesday, October 18, 2016

Key Facts: How does Kansas school funding compare to other states?

According to national reports which use headcount enrollment, Kansas funding per pupil in 2013-14 (the most recent year available) was 29th among the 50 states, a drop from 24th in 2008. Because most Kansas school aid was frozen under the block grant system for 2016 and 2017, and most states have been increasing funding, this ranking is expected to continue to decline.


Kansas also spends less of the total income of the population on K-12 education. According to the same national report, Kansas spent $42.74 per $1,000 of personal income, ranking 33rd in the nation.


Funding per pupil is important because the nine states with highest overall achievement on 15 educational indicators all spend more per pupil than Kansas (KASB State Education Report Card). That’s true both in terms of actual dollars per pupil in 2014, and if per pupil spending is adjusted for state cost of living differences using the Regional Price Parity Index from U.S. Bureau of Economic Analysis.


In other words, Kansas educational performance is very high compared to other states, even though spending is below average. However, higher achieving states all spend more per pupil than Kansas.

Follow-up: Some say Kansas actually ranks as high as third or fourth in state funding for education. What is the conflict?

Kansas does rank high in the share of the state budget going to education. However, this doesn’t mean Kansas ranks high in total funding for education per pupil. Instead, it means Kansas has chosen to rely more on state aid and less on local revenues, which mostly come from property taxes. Most other states choose to have a different mix of funding for schools, but they also provide more total revenue. Another difference could be simple changes in accounting. The 20 mill statewide levy for school districts were previously considered a local revenues; now it is sent to the state and redistributed back to districts. That makes the “state” contribution higher, but provides no additional aid for districts.

Monday, October 17, 2016

Key Facts: How much does Kansas provide per pupil for K-12 education?

According to the Kansas State Department of Education website, Kansas school districts spent $13,124 per “full-time equivalent” pupil in school year 2014-15. This number includes all state and federal funds, all local revenues, all retirement costs and all student fee revenue, including student meals, books and other costs. This is the state average; individual districts may be higher or lower.


However, that number counts all kindergartners as half-time students, even though most kindergartners attend full-time. It also does not count more than 5,000 students in preschool programs funded by school districts. Using headcount enrollment, which counts all of these students, per pupil spending drops to $12,138.


If looking only at state aid (which would not include federal funding, local property tax revenue or income from student fees, but does DOES include KPERS retirement contributions), per pupil spending was $8,644 - using the FTE enrollment that does not count all day kindergarten students and district paid pre-schoolers. If looking only at state and local operating funds (district general fund, local option budget and special education aid, but NOT KPERS, building and equipment costs, federal programs, meals and student fees), per pupil spending is $8,346.


Follow-up: Some report lower numbers for Kansas spending per pupil. Why the difference?


As noted above, some comparisons use only state funding, or state and federal funding but not local revenues. Some may only use funding for operational costs and exclude spending on buildings and debt service. Some may exclude state contributions for the Kansas Public Employees Retirement System because these dollars cannot be used for school operations. Finally, some comparisons use only the base state aid per pupil amount from previous funding system, which was $3,852.


As a result, the “correct” answer about spending per pupil depends on what you really want to know, and why. For example, suppose an individual is seeking a loan and is asked “what is your annual income?” The individual will usually give their “take home pay.” That answer would probably not include fringe benefits and deductions for insurance and contributions for retirement, whether paid by the employee or the employer; and it certainly wouldn’t include the employer’s share of payroll for things like social security and unemployment. However, it’s the “right” answer for a lender who wants to know how much income the individual really has available to repay a loan, even though the employer is actually “spending” more than the employee takes home from a paycheck.

Likewise, in a local school district budget, much of the revenue is not available for regular educational operating costs, even if is being spent on other important costs.

Friday, October 14, 2016

Key Facts: How do Kansas education results compare to other states?

When considering multiple measures (test scores, graduation rates, postsecondary participation), Kansas ranks among the top states - 10th on the most recent report from KASB. Kansas ranks higher than the U.S. average, neighboring states, and states most like Kansas demographically.


These results give Kansas students an advantage because higher education levels have higher average pay and employment rates, and more jobs in the future will require higher educational credentials.


However, on most of these measures, other states have been improving faster than Kansas in recent years, which means more states could begin to pass Kansas in achievement.


Follow-up: Some say Kansas performs only about average on national measures. Is that true?

It depends on the specific test or other measure. Like all states, Kansas does better on certain tests or with specific groups, and worse on others. That is why KASB uses an average of various tests, measures and groups of students, rather than any single indicator.

Thursday, October 13, 2016

Key Facts: What are current Kansas education achievement levels?

Overall education levels in Kansas are at an all-time high. This includes the percent of population that has completed high school, any level of postsecondary education, or completed a four-year or advanced degree.


More young Kansans (18-24 years old) are completing high school, beginning college and completing degrees than ever before.


However, as has been true in the past, students from low-income families, students with disabilities and students learning English as a second language continue to lag behind other students.

Follow-up: Some say a majority of Kansas students are “failing” or “not proficient” or “not college ready.” Is that true?

When test results show a majority of Kansas students are below a benchmark, they are referring to a high performance level generally aimed at college level-preparation. In the past, most students did not need to reach these levels because students did not need or expect to complete a four-year degree or more. It’s not that more students are failing; it’s that standards have been raised.