The latest official consensus revenue estimates for the Kansas state general fund were released Nov. 10. Much of the attention has focused on a $345 million drop in expected revenues in the current year, as well projections for significant budget deficits in the next two years. KASB takes a more detailed look at how the new projections compare to longer term economic and budget trends in Kansas, and what it means for education funding.
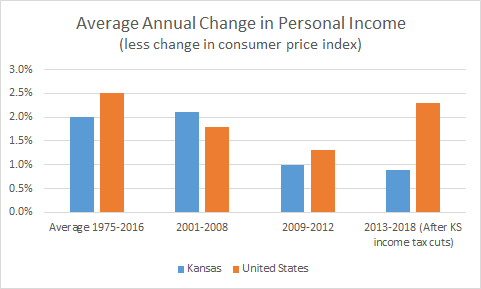
The first part shows how Kansas personal income has consistently fallen below projections and trails the national average. The second part shows how state tax revenues have not kept up with income growth since the major income tax cuts of 2012 have decreased revenue to the state, resulting a lower percent of economic growth invested in education and public services. The third part shows how the failure of the Kansas economy to recover from the Great Recession and the failure of the tax cuts to stimulate the economy have squeezed state spending, including education.
Part 3: Slow economic growth and tax policies have an impact on school funding.
Slow income growth and lower tax revenue growth almost inevitably mean less growth in school finance, which relies on state aid for two-thirds of its funding. (Kansas is higher than most states in this regard. The trade-off for a higher share of state funding is that it allows lower property taxes and less funding disparity due to major differences in local tax resources.)
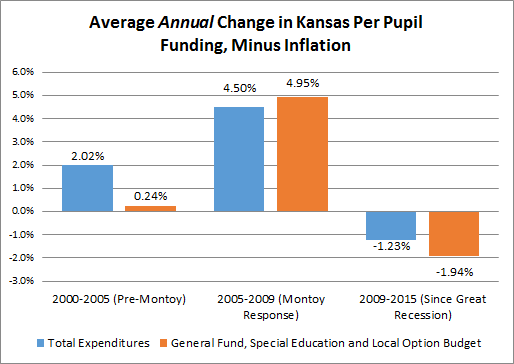
Using the best records available, total school district funding in Kansas has averaged a 5.6 percent increase per year since 1975, or 1.8 percent after adjusting for inflation. When considering general operating funding (general fund budgets, special education state aid and local option budgets) the average annual increase since 1975 has been 5.3 percent, or 1.6 percent after inflation, slightly below total funding.
Since 2008, however, total funding has increased an average of 1.3 percent, and after adjusting for inflation, actually declined an average of less than 0.1 percent per year. However, since 2008 most of the growth in school funding has been in areas set by local voters, such as bond issues, or higher contribution rates for the Kansas Public Employees Retirement System.
These expenditures are not part of general operations. As a result, general operating expenditures (defined as school district general fund, local option budget and special education state aid) increased an average of just 0.71 percent per year since 2008, and actually declined an average of 0.7 percent per year after inflation. This is why school boards, staff, parents and communities see “cuts” in personnel and programs even though total funding may be higher - because dollars available for general operations have lagged behind inflation.
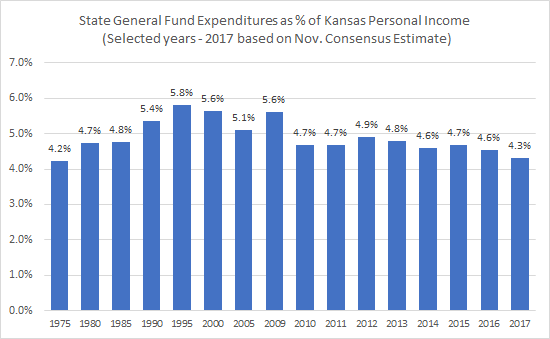
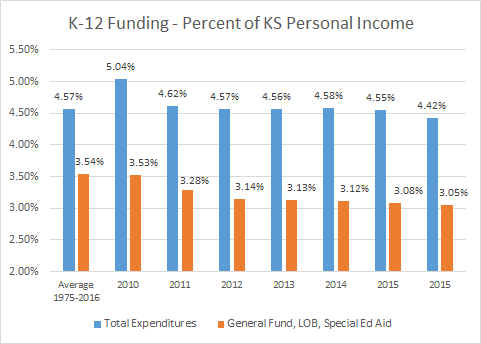
As a result, school funding has been declining as a percent of personal income. Total K-12 funding has averaged 4.6 percent of Kansas personal income since 1975 and topped at 5.0 percent in 2009 and 2010, but is estimated to be 4.4 percent in 2016 - the lowest level in 30 years. General operating funds averaged 3.5 percent of personal income but are estimated to be less than 3.1 percent in 2016 - the lowest level recorded.
In other words, Kansans are providing the lowest share of income to K-12 in decades for this generation of students, even as school district expectations for student performance have continued to increase.
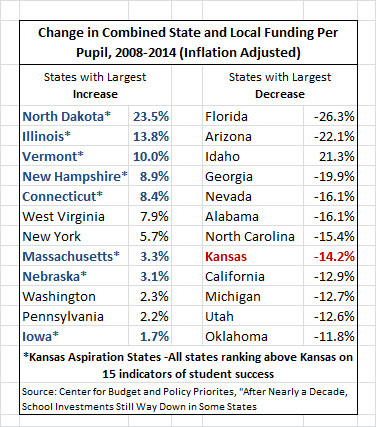
Kansas funding has also fallen behind the nation. Kansas total revenue per pupil was 97.5 percent of the U.S. average in 2009 but declined to 93.7 percent in 2013, the most recent year available. It is likely Kansas has fallen further behind since then because the U.S. economy has been growing faster than Kansas, but official data on state school funding lags several years behind.
The most immediate issue for the Governor and Legislature is the reduction of $346 million in anticipated revenues for the current year (FIscal 2017). Because the Legislature built a budget with a very small ending balance - and because actual tax revenues for 2016 were over $100 million less than expected - the Legislature will have to make almost $350 million in “adjustments” to avoid a deficit in the state general fund.
That equals over 5.5 percent of approved expenditures in a budget year that will be more than half over when the Legislature returns in January. Adjustments could mean spending cuts, payment delays, or new revenues (raising taxes).
One part of the problem is that the Governor delayed an additional $75 million in state aid due to be paid to schools in at the end of June. That delay saved the state $75 million and helped avoid a deficit, but adds $75 million in FY 2017. An option likely under serious consideration is to make a similar delay - or even larger - from June 2017 to July of 2018.
Such a delay could be even larger because the 20 mill statewide levy and mineral production fund will raise less than expected in current year FY 17. There is no revenue to make this up in the state general fund profile, which would make the deficit even larger if included. That could be added to the delay (pushing into next year), or school district funding could be reduced.
If a similar delay in state school aid was made again (and perhaps increased to $100 million), the Governor and Legislature will still face a projected $250 million gap, equal to over 4.0 percent. Even if the Legislature (and Governor) agreed to increase taxes at some level, it is extremely difficult to do so in time to raise much revenue for 2017.
The situation in 2018 and 2019, the upcoming two-year budget the Governor will propose and the Legislature will adopt, is less clear. Legislative Research Department budget profiles show budget gaps of $582.6 million in 2018 and $172.3 million in 2019. However, those numbers assume the Legislature returns to “current law” on transfers into and out of the state general fund. That means the Legislature would stop transferring money from the state highway fund and early children revenues; and start sending money to programs that have not been funded for years.
Even if the Legislature continues current transfers (which has been extremely controversial), tax revenues are expected to grow just 1.4 percent in 2017 and 2.4 percent in 2018. If school district state aid grew at the same rate, the current roughly $4 billion in state aid would increase by $56 million in 2018 and $97 million in 2019. The KPERS contribution for school districts is scheduled to increase $78.6 million in 2018 and $45.5 million in 2019. In additional, bond and interest state aid is expected to increase enough to use up any new revenues at those rates.
In other words, any increase in school district operating budgets would require continuing current transfers AND either increasing school spending more than other programs or raising taxes - unless state revenues begin growing much more rapidly. (Not addressed is how or when the state would be repay approximately $100 million in KPERS payments that were not paid last year.)
To put this all in perspective: if you, your children or grandchildren attended Kansas public schools between 1975 and 2008, Kansas taxpayers spent on average of 4.6 percent of total income on K-12 education, and increased spending an average of 1.8 percent more than inflation every year, allowing school districts to hire more teachers and support staff, offer more programs and services and keep salaries and benefits competitive.
However, since 2009 - the entire time that current eighth graders have been schools - the share of income going to K-12 education has been declining, and annual funding increases have averaged less than the rate of inflation. While education funding in most states has recovered since the Great Recession, Kansas lagged behind. Over this same period, indicators of student success - test scores, graduation rates, preparation for and participation in postsecondary education - have slipped for Kansas students.