Tuesday, December 10, 2013

School Boards Adopt Policies for Improving Kansas Education

Delegates to the Kansas Association of School Boards annual convention in Wichita on Sunday approved a set of policy recommendations for improving educational outcomes in Kansas, focusing on raising educational standards, providing suitable finance and strengthening local school leadership.

The association endorsed higher standards for students graduating Kansas high schools and targets for improving state educational attainment to meet projected Kansas jobs requirements over the next decade.

Delegates reaffirmed support for the principles of collective bargaining and due process rights for teachers, but said changes should be made to improve state law in both areas.  KASB leaders said they hope to find common ground with teacher and administrator organizations on these issues.

KASB also voted to support the current constitutional status and authority of the State Board of Education.

Here is the full text of resolution adopted December 8, 2013:

First in Education, Kansas Way
Kansas Association of School Boards – 2014 Priority Issues
Adopted December 8, 2013
PrincIple I.    Raise Standards for Success.  Continue to improve educational outcomes by raising standards for students, educators, schools and districts.
A.  Students Ready for Success.  Set expectations for all students to graduate high school with the skills required for college and careers, as demonstrated by academic preparation, technical skills, employability skills, and interest development; and provide individualized support from early childhood through high school.
1.  Definition:  We support the State Board of Education’s definition that College and Career Ready means an individual has the academic preparation, cognitive preparation, technical skills, and employability skills to be successful in postsecondary education, in the attainment of an industry recognized certification or in the workforce, without the need for remediation.
2.  Student Expectations.  We support development and implementation over time of a system to ensure all students graduating high school meet a higher standard than currently required.  This should include:  (1) Demonstration of a minimum statewide standard of basic academic skills.  (2) A locally-determined demonstration of employability and citizenship skills for all students.  (3) Demonstration of preparation for postsecondary employment or education (technical certification or industry credential, associate’s degree, baccalaureate degree, etc.) based on the career interest of the student.
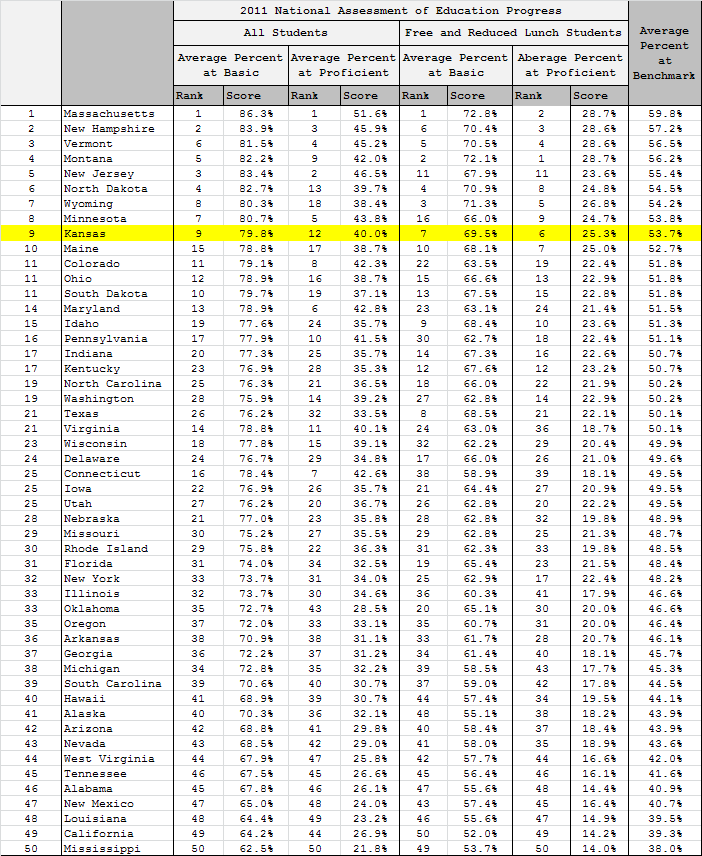
3.  Graduation Targets.  We support these goals for Kansas educational attainment, based on projections of employment needs by 2020.  Because employment needs differ by location, individual districts should be responsible for showing proportional increases in attainment rather than statewide targets. (1) At least 40 percent of graduates prepared to pursue a four-year degree or higher, compared to 30 percent of Kansas adults currently; (2) At least 35 percent of graduates prepared to pursue a two-year degree, technical credential or industry certificate, compared to 32 percent of Kansas adults with some college but less than a four year degree; (3) 95 percent of students graduating high school by age 24, compared to 90 percent of Kansas adults.
4.  Career Interest Development Programs.  We support a program to encourage and support districts adopting student career programs meeting standards adopted by the State Board.
5.  Financial Education.  We support a program to encourage and support districts in developing personal financial literacy programs, based on local needs and capacity.
B.  Effective Educators.  Improve educator training, licensure, and retention policies using performance-based evaluation and continuing professional development while providing appropriate protections and benefits.
1.  Student Impact.  We believe state law and Kansas State Board of Education policies should require districts to adopt administrator and teacher evaluation policies meeting standards adopted by the State Board, including a requirement that the most important evaluation factor be impact on student improvement based on multiple measures.
2.  Evaluation Input.  We support removing evaluation procedures from professional negotiations to facilitate improvement in instruction, with administrator and teacher input into the evaluation process independent of negotiations.
3.  Alternative Licensing.  We support options for licensing teachers who have not completed regular requirements for teacher training, provided such teachers annually receive high level evaluations for effectiveness.
C.  School Performance.  Establish a school accountability system for core academic subjects based on achievement, growth, and narrowing differences in student performance.
1.  Accountability Measures.  We support public accountability based on reading and math assessments measuring the movement of students to increasingly higher achievement levels, annual student growth, narrowing the gap between high and low performing students, and reducing the number of non-proficient students.
2.  Intervention and Support.  We support funded interventions to assist low-performing or non-improving schools and districts.
3.  Assessment.  To assess student performance, we support implementation of an improved testing program aligned with the Kansas College and Career Ready standards, measuring college and career readiness and higher-order skills.  KASB supports allowing districts to choose among different assessments equally benchmarked against state standards.
D.  District Accreditation.  Adopt a new accreditation system to encourage and recognize districts for student outcomes, programs and practices that support student success, including school board and district leadership.
1.  Broader Focus.  We support the concepts under development in the Kansas State Board of Education’s “21st Century Accreditation” model to provide a broader measure of school district performance and encourage best practices while minimizing additional state mandates.
2.  Board Development.  We believe the new accreditation system should require locally-developed programs for the continuing education and improvement of school boards and their members.  Such programs would be developed by local boards, and evaluated using the same system as other accreditation areas.
Principle II.  Finance for Success. Provide constitutionally suitable funding for continuing educational improvement in all districts.
A.  State Responsibility.  The state should pay for what it requires schools to do, including costs that rise each year, as part of “base” funding for all districts.
1.  Base Funding.  We support increasing statewide education funding and the per pupil amount for each district, based upon the statutory level approved by previous legislatures and the Kansas Supreme Court and recommended by the State Board of Education, studies of educational costs, funding levels in the highest achieving states; traditional levels of educational funding compared to state income; and annual increases in operating costs and state requirements.
2.  Cost Differences.  We believe the school finance system should provide additional funding through weightings or other mechanisms for higher cost students, districts and programs, particularly those required by the state.
3.  Long-Term Funding.  We support continuation of multi-year funding for school districts.
B.  Funding Equity.  Balance increased local funding options with increased state equalization aid.
1.  State and Local Balance.  We support a balanced plan for school funding increases that provides both increases in base aid and local option budget authority, contingent upon full funding of LOB state aid as recommended by the State Board of Education to reduce disparity in local school district property tax rates.
2.  Capital Costs.  We support continued state equalization aid for capital improvement bonds and restoration of capital outlay aid as recommended by the State Board.
C.  Targeted Aid.  Maintain the successful at-risk funding system based on economic disadvantage and other factors; improve instruction through professional development and mentoring; and promote innovation.
1.  At-Risk Students.  To improve mastering of skills and preparation for college and careers for all students, we support the use of free lunch eligibility as the primary factor for at-risk funding in order to provide stable revenues for these successful programs, supplemented by other risk factors.
2.  Instruction.  To improve instruction, we endorse the State Board’s 2014-15 funding request for Professional Development state aid, Teacher Mentoring and National Board Certification.
3.  Graduation.  To improve the graduation rate, we support state funding for Communities in Schools.
4.  Innovation.  To promote new ways to achieve these goals, we support creating a grant program for innovative programs and strategies.
5.  Program Focus.  We would support provisions in each of these programs requiring a focus on raising student mastery of basic skills, improving instruction and evaluation, and increasing the number of college-and career-ready students.
D.  Efficiency.  Encourage cooperation, services sharing, consolidation and efficiencies, balanced with local needs and priorities.
1.  Consolidation and Cooperation.  We support maintaining current incentives for voluntary school district consolidation, and support additional incentives for consolidation and cooperation.
2.  Sharing.  We support a statewide study of ways to promote school district cooperation and sharing of academic programs, personnel and operations.
E.  Tax Policy.  State tax cuts should not reduce school funding when improving education is vital to the economic health and quality of life for the state, communities and individuals.
1.  State Revenues.  We support state tax policies that provide increasing education funding necessary for increasing educational outcomes.  If current tax policies do not provide revenue to meet these costs, state tax policies should be revised.  Changes in education funding and tax policy should not increase disparity in local tax efforts, and any new revenue source should be equalized.
2.  Tax Policy.  We support efforts to broaden the tax base by reducing special exemptions and credits and oppose further targeted tax reductions.
principle III.  Local Leadership for Success.  Strengthen responsiveness to parents and community needs under locally elected boards and school leadership.
A.  Local Decision-Making.  Support local policy and funding choices unless the school persistently fails to demonstrate improvement; oppose new requirements without clear evidence of effectiveness and funding for additional costs.
1.  Limit State Intervention.  We believe the best response to educational issues is almost always determined at the local level, rather than the state or national level. State policies should address outcomes to be achieved, not methods to achieve them. State intervention should be focused on schools or districts that fail to meet ambitious but reasonable standards.
2.  New Mandates.  To focus on the student mastery of basic skills and college/career readiness, we oppose any new state or federal requirements except for the proposals contained in this First in Education plan.
B.  Innovation.  Promote flexibility in educational programs, accountable to local boards and state accreditation.
1.  Local Flexibility.  We support giving local school boards more flexibility in developing programs and operations.
2.  Accountability.  We support promoting innovation within the public school system so successful initiatives can be replicated, rather than authorizing and funding charter schools and other institutions outside the constitutional authority of local boards.
C.  Employee Relations.  Strengthen board and administrator management flexibility while maintaining core employee rights.
1.  Professional Negotiations.  We support continuation of collective bargaining between school boards and teacher associations.  We believe changes should be made in the professional negotiations act to strengthen professionalism and efficient district operations, which we would seek to achieve through negotiations with teacher representatives.  If agreements are reached that are acceptable to the KASB Board of Directors, KASB will oppose further amendments to the PNA.
2.  Due Process.  We support the current system of due process rights for teachers if the process is clarified to allow boards of education to remove teachers as long as such removal is supported by a preponderance of evidence.  The board's decision should be given deference unless its action was arbitrary, capricious, or unsupported by evidence.
D.  Constitutional System.  Maintain the elected Kansas State Board of Education for general supervision of public education, the authority of local elected boards over public schools; and prohibition of public education funding for religious organizations.
1.  State Board.  We support an elected Kansas State Board of Education with authority over the Commissioner and Department of Education, with general supervision of local schools as provided by the Kansas Constitution.
2.  Private Schools.  We support the constitutional prohibition of state educational funding for religious organizations. KASB supports the authority of local school boards to provide services to private school students.
3.  Judicial System.  We support the role of an independent judiciary in enforcing constitutional provisions.  We oppose either changing the selection process for judges from the merit selection system, or limiting the ability of the courts to enforce those provisions, which would weaken the traditional separation of powers in Kansas.
E.  Parent and public engagement.  Increase public understanding of educational issues and support for improvement; strengthen involvement of parents, higher education, employers and communities.
1.  Local Engagement. We believe public and parental engagement cannot be effectively legislated but is the responsibility of local schools and districts.
2.  Local Elections. We believe public engagement in school district governance is best served by electing local board members in non-partisan April elections, rather than the November general elections.

Wednesday, December 4, 2013

Innovative Districts, KPERS Liability Shift to Districts, State Aid Cuts to Locals

Here is a quick round-up of news this week:

Innovative Districts

The Topeka Capital Journal reports that eight school districts -  McPherson USD 418, Blue Valley USD 229, Concordia USD 333, Hugoton USD 210, Kansas City Kansas USD 500, Seaman USD 345, Santa Fe Trail 434 and Sterling USD 376 - have applied for innovative school district status under a bill passed last Legislative session.

Under the procedures set for the the bill (described here), the first two districts must be approved by a majority consisting of the Governor and chairs of the Senate and House education committees.  If approved, the applications goes to the State Board of Education, which in turn must approve the applications if they meet requirements specified in the bill.  Once the first two districts are approved, they constitute a board of the Coalition of Innovative Districts, which must then approve other district applications, followed by approval of the State Board.  Additional approved districts then become part of the Coalition's board.

Key to the bill is that innovative districts must set out education goals and measurements, and then receive an exemption from most state school laws and regulations.  The innovative status is granted for five years, but can be revoked if districts fail to demonstrate student improvement on various measures for two years in a row.

KASB supported passage of the bill. It was opposed by the Kansas National Education Association because it could allow districts to waive laws regarding employee rights.  The State Board of Education has asked the Kansas Attorney General to interpret whether the law overrides authority of the State Board and local boards as set forth in the Kansas Constitution.

KPERS Liability Shift to School Districts Unresolved

After briefing the Legislative Post Audit Committee Tuesday, the executive director of the Kansas Public Employees Retirement System says there is still no final decision on whether local units of government must show billions of dollars in unfunded pension costs on their balance sheets, but warned it is a strong possibility this change will be made.

The pending change was prompted by new national accounting standards, but final guidance from the Governmental Accounting Standards Board has not been released and the Kansas Department of Administration has not made a final decision, says KPERS Chief Alan Conroy.  He noted that the KPERS liability is not currently reported by either the state or local employers.

KPERS has released the following issues brief on the new GASB guidelines, including “special situations for schools” on page 2.  The primary impact of such a change would be showing increased liability on the balance sheets of local governments, including school districts, when seeking to issue additional debt through bonds.  There could also be some additional costs for calculating the liability of individual districts.  However, the new rules will only apply to local governments that follow Generally Accepted Accounting Principles, and KPERS estimates that only about 300 of 1,500 local governments currently do so.

The reporting change will not, by itself, change who is responsible for making employer contributions.  Currently, the state makes an appropriation to cover the employer contributions for school districts.  These funds are transferred to school districts and then immediately transferred to KPERS.  As a result, school districts shows this payment in their budgets as both a revenue and expenditure.  Other local units of government (cities, counties, etc.,) are responsible for making these payments for their employees without state aid, increasing from $82 million, or 2.3 percent of total school district budgets, in 2000, to $366 million and 6.2 percent of budgets this year.

Because of the significant unfunded liability in the KPERS state and school employee groups, the state has been increasing its contributions in recent years.  KPERS contributions have been the fastest growing part of school district budgets over the past decade.

State Aid Cuts Affecting School Districts

The Kansas Center for Economic Growth has released a new report on the impact of state funding cuts on local services.  Here is a link the report.
According to the Center's report, local governments have seen significant decreases in state government aid that affect neighborhood community health programs, schools, safety initiatives and libraries.   In particular, it notes that school districts have reduced staff and state funding for professional development has been eliminated.
According to KASB analysis of Kansas State Department of Education data, total school district full-time equivalent (FTE) employees increased from about 65,155 in 2002 to 70,409 in 2009 as state funding and local option budget authority increased, dropped to 67,860 in 2012 due to state budget cuts, and rebounded to 68,569 last year.
Total school employees actually increased about 1 percent between 2011-12 and 2012-13 after the Legislature funded an increase in base state aid per pupil and some districts increased their LOB.  However, the total number of school employees is still down 2.6 percent from 2009, even after the 1 percent increase last year.  The total number of employees is still about 5.2 percent above 2002.

For a closer look at changes in school employees over the past decade, see this blog posting, including a detailed chart showing each category of employee at the end.

Thursday, November 7, 2013

Special Committee on Education: First Results of New NAEP scores

Yesterday, I attended a meeting of Special Interim Committee on Education, and spoke on Kansas results on the National Assessment of Education Progress.  

Here is link to my testimony from yesterday.

Here is the story from the Topeka Capital Journal, and a report from the Lawrence Journal World.

Also today, the 2013 NAEP results were released this morning.  Here is quick media report.  I'll be doing a more detailed report later.

Friday, October 25, 2013

Setting the Record Straight on School Employees and Spending

I’ve been asked to comment on an ad that Americans for Prosperity has been running in recent months touching on several topics: the total amount of spending per pupil in Kansas (over $12,000 for the past five years), the share of that money going to teacher salaries, and claims over the past decade, for every two teachers, five “non-teaching” positions have been added.

A similar issue was raised by a state representative at the joint meeting between the State Board of Education and members of the House and Senate Education Committees, who said he was aware of a small district in Kansas had more “administrators” than “teachers.”  These comments reflect a theme that too little funding gets to “the classroom” to help students and teacher, and implies that schools are drowning in unnecessary bureaucracy.  What is the truth about these claims?

Instruction/Teachers vs. Administration/Bureaucrats

Let’s start with some definitions.  Discussions about “dollars in the classroom” usually rely on a federal reporting definition used by all districts and states for “instruction.”  This includes salaries and benefits for teachers and (importantly) teacher aides and paraprofessionals.  According to Kansas State Department of Education data, there were nearly 35,000 licensed teachers employed in Kansas districts last year, along with over 10,000 non-licensed aides and paraprofessionals. These individuals made up 65 percent  of the 68,568 total employees in Kansas school districts.  (Note: these are “full-time equivalent” or FTE positions.  Therefore, an employee who works only half a day would be counted as 0.5.  According to U.S. Census Bureau, the “head count” of school district employees is over 80,000.)

I suspect when people hear that “only” 65 percent of school employees are teachers or “instructional,” the implication is the other 35 percent really do not contribute to student learning.  In other words, if a school district employee isn’t a teacher, he or she must be an administrator or (even worse), a “bureaucrat.”  So what are these “non-teachers” doing?

The federal definitions include eight other major “functions” of education that support both students and teachers and provide for the management and operation of schools.  These include:

  • Student support - counselors, health services, psychologists, speech pathologists, social workers and school resource officers.
  • Instructional support - library and media center specialists and aides, technology support and curriculum support.
  • General Administration - superintendents and their central office staff.
  • School Administration - school building principals and their office staff.
  • Other Support Services - business managers, office staff.
  • Operations and Maintenance - utilities, insurance, custodial, security.
  • Transportation - bus drivers, vehicles and maintenance, fuel.
  • Food Service - cooks, food and food preparation.

Instructional employees have been increasing; administrators decreasing.

KASB has been compiling data from the State Department of Education from over a decade.  Between 2002 and 2013, total school districts employees increased by nearly 3,400.  Actual teacher positions increased by 1,315, or 40% of the total, which seems to be what the AFP ad is referencing.  However, other instructional positions (classroom aides, special education paraprofessionals, Parents as Teachers staff) increased by 2,679 - which means the total increase in instructional “in the classroom” staff was GREATER than the total increase in district employees.

As the chart below shows, instruction (direct contact with students), student support (services to address student guidance, mental and physical health and social needs) and instructional support (direct support of classroom teachers) are the only areas of school district operations to increase staff over the past decade.  District and school level administration, operations and support staff, food service and all other areas have been reduced, and transportation staff has remained about the same.


The next chart, which shows the percentage of spending on each function, looks very similar.  This data includes not only salaries but all other expenditures, such as supplies, utilities, fuel, food, etc.  It does NOT include the costs of long-term equipment, building construction, repair and remodeling, and payments on bonds for new construction.


Both charts make clear that looking “only” at instructional or “in the classroom” expenditures ignores significant aspects of school operations.  Sixty-one percent of current operating expenditures goes to direct instruction.  Nearly 10% goes to direct services to students, families and teachers.  About 4% pays for transporting students to and from “the classroom” or activities.  Five percent is spent on school meals.  About 10% is spent to heat, cool, clean, insure, secure and maintain classrooms and other school facilities. Finally about 10% is spent on “administration” at all levels - which includes everything from overseeing the district to evaluating and directing staff to managing student discipline and engagement with parents and the community.

Is using about 10% of your employees to manage, supervise or “administer the other 90 percent unreasonable?  According to the 2012 Statistical Abstract of the United States, 11% of the national civilian workforce is employed in “Management, business, and financial operations” jobs, which means Kansas school districts basically reflect the national economy.

Frankly, if any of these “non-instructional” functions were significantly reduced, it would either mean fewer services for students or more duties and less support for teachers.

Kansas school employee distribution and spending decisions are serving students well.

The AFP ad claims Kansas students are being short-changed by school spending decisions.  Let’s look at the data.  The federal government, which uses a slightly different way of calculating spending on instruction and current spending, reported that Kansas dedicated about 62% of current spending to instruction in 2011 - ranking 12th in the nation in the percent of current spending used for instruction - so Kansas actually ranked quite high in “dollars to the classroom.”

By most national measures of state performance (test scores, graduation rates, college preparation and completion), Kansas also ranked among or near the top ten states.  However, our current spending per pupil ranked 27th in the nation and instructional spending per pupil ranked 26th, so Kansas is clearly achieving very high results compared to its level of spending.  As we have previously noted, on almost every measure, the few states with higher achievement than Kansas spent more per pupil and had far fewer at-risk, low income students.

In other words, far from being “short-changed,” Kansas students get better results than about four-fifths of the other states, even though more than half of the states spend more per pupil than Kansas, and more than half the states have a lower percentage of low income students.  In fact, there is no evidence that spending a higher percentage of current resources on “instruction” would provide better results.  KASB compared instructional spending as a percent of current spending with state results on national math and reading tests at fourth and eighth grade, and found a small negative relationship between two.  That means states spending a higher percentage on instruction were slightly less likely to have higher student achievement.  (KASB analysis of national data comes from the National Assessment of Educational Progress for reading and math, and Public Education Finances: 2011).

Which brings us to the final point.  Schools are often accused of failing to operate like a business.  Yet what analysis of business operations would begin (and end) with the share of spending going to a particular segment of the workforce, rather than looking at results?  For some critics of public education, the implication is that local school board members are incapable of making good decisions about how to allocate resources and staff - despite the fact that Kansas schools continue to deliver “top ten” results while spending less than most states and educating a higher percentage of income students than more states.

It’s up to school leaders to change that perception.  You can share with Legislators, parents and the public the real data about your school district’s employees and how you spend your money.  This page on the KSDE website takes you to a number of KSDE reports.  Clicking on “personnel” allows you to access spreadsheets listing the Certified and Noncertified employees in each district, for school years 2008-09 through 2012-13.  This page allows you to access information on the current operating expenditures for the entire state and each district for 2011-12, and previous years back to 2004-05.

Of course, the KASB research department can help you access this information and prepare customized reports for your districts.

The chart below shows the statewide change between 2002 and 2003 for all categories of school district employees, grouped by school district budget “function.”


Friday, October 11, 2013

National Reading, Math Tests Show Higher Achieving States Spend More Per Pupil than Kansas

One of the most important debates about educational achievement is the role of funding. This week, the Kansas Supreme Court heard arguments in the Gannon case. The plaintiffs argue that the state is failing to meet its constitutional obligation to “provide suitable finance for the education interests of the state” because funding levels have been reduced or have not kept up with costs. The defense says that Kansas student achievement is quite high, suggesting overall funding levels are adequate. Others argue Kansas doesn’t need to spend more money on education because higher funding doesn’t result in better outcomes.


To test these contentions, KASB studied the results of the 2011 National Assessment of Educational Progress (NAEP) and other state data from the National Center for Education Statistics.  Here’s what we found: higher achieving states almost always spend more than Kansas and there is a positive statistical correlations between higher spending and better results.  These results follow an earlier study that showed states with higher spending have higher college readiness results on the ACT test.


The NAEP is given to a sampling of students in all 50 states every two years. (This allows state scores to be reported but not individual district or student scores.)  Students are tested in reading and math at grades four and eight.  In addition to an average “scale score” in each state, NAEP also reports the percentage of students scoring at certain benchmark levels: Below Basic, Basic, Proficient and Advanced.


KASB research has shown that the percentage scoring at Basic is a good indicator of the state’s graduation rate, i.e. the percentage of students who complete high school.  The percentage scoring at Proficient is a rough indicator of the percentage of students who will meet college readiness benchmarks on the ACT test.  In other words, the percent at Basic might be considered the percentage of student “on track” to graduate, and the percent at Proficient indicates those “on track” to be ready for college-level academics.

Kansas ranks among top performing states


To measure overall state performance, we calculate the average of the percentage of students scoring at both Basic and Proficient on the four tests (Grade 4 reading and math; Grade 8 reading and math).  We then rank the average percent for each state.  The results are shown in Table I near the end of this story.
Eight states top the nation with average scores of 80% or higher at Basic for all students.  Kansas is just outside this group, ranking 9th at 79.8%.  Ten states rank at the bottom with scores below 70%.  Likewise, 12 states top the nation with 40% or more students scoring at Proficient or higher, including Kansas.  Nine states have less than 30% at Proficient.


As explained in an earlier post, lower income students usually score much lower than upper income students.  To see how states perform in educating their lower income at-risk students, we used the same approach to average the percentage of students eligible for free or reduced lunch who score at Basic and Proficient on the four tests.  The percentage of low income students meeting these benchmarks is generally about 10 points or more lower than all students.


Six states have 70% or more low income students at Basic, with Kansas ranking 7th at 69.5%. Thirteen states have less than 50% of low income students at Basic.  Seven states have at least 25% of low income students at Proficient, including Kansas (6th at 25.3%).  Ten states have fewer than 18% of low income students at Proficient.


Averaging these four state percentages (all students at Basic and Proficient, low income students at Basic and Proficient), Kansas ranks 9th (53.7% average percent at benchmark).  It’s clear that Kansas ranks among or just below the highest achieving states in the nation, both for all students and specifically for low income students.  What are we spending to get those results?


Using the most recent national data (for the 2010-11 school year), Kansas ranked 27th in total revenue per pupil at $11,472.  (Total revenue includes ALL school districts revenue from state, federal and local sources.)  Kansas ranked 28th in the nation in current spending per pupil at $9,498 (Current spending excludes long term expenditures such as buildings and equipment, payments on loans and pension costs.)  Kansas also had a fairly high percentage of low income students: 47.7%, compared to the national average of 48.1%.  In fact, 30 states have a lower percentage of low income students than Kansas.

National Test Results and Education Spending

At first glance, this data would seem to support the state’s claims in the Gannon lawsuit. Kansas schools are producing very high results compared to other states, while spending below the national average. Kansas also ranks very high even though most states have fewer low income, at-risk students. In fact, Kansas ranks even higher for low income students than it does for all students. Do our own achievement results indicate current funding is “suitable?” It would seem to depend on whether the status quo is acceptable or “suitable.” The Kansas Constitution mandates a system of public schools for “intellectual, educational, vocational and scientific improvement,” which the Supreme Court has said indicates the status quo is never good enough, because the people have mandated continuing improvement.

Even if the constitution itself doesn’t mandate improvement, the constitutionally elected State Board of Education has continued to set higher standards. Most critics of Kansas public schools claim educational achievement falls short of the mark. Economic data indicates Kansas must increase the percentage of high school graduates and college-ready students to meet future employment needs and provide “middle class” incomes. In addition, the testing and funding data presented above is several years old, and new national reports have indicated Kansas has further reduced spending compared to most other states.


If the question is not what it costs to achieve current results but what it costs to achieve even higher results, here are some key facts to consider.


  • With just two exceptions, every state with a higher percentage of all students and low income students meeting Basic or Proficient benchmarks spent more per pupil than Kansas in 2011.


  • Colorado, which had both lower current spending and total revenues per pupil than Kansas, ranked higher on just one benchmark (all students at Proficient).  Montana had over $1,000 higher current spending per pupil than Kansas, but just slightly lower total revenue per pupil ($38, or 0.3%).


  • Both Colorado and Montana had far fewer low income students than Kansas.  Colorado had 39.9% and Montana 41.2% students eligible for free and reduced meals, compared to 47.7% in Kansas.  Colorado also had much lower achievement for low income students, ranking 22nd at Basic and 19th at Proficient - about 15 spots lower than Kansas.


KASB also looked at the statistical correlation between spending per pupil in each state and the percentage of students at NAEP benchmarks.  In each case, we found a positive correlation as follows:


Although there is no hard and fast rule for the strength of statistical correlation, many sources suggest that a positive correlation of 0.4 and above is a moderate to strong relationship, and that a correlation of 0.3 is a moderate relationship.  Even a correlation above 0.2 indicates at least some relationship.


The totality of the evidence indicates that funding does play an important role in state student achievement and that it will be extremely difficult - and, in fact, unprecedented - for Kansas to improve achievement on NAEP results without additional revenues.


Table I


Table II: