Wednesday, October 15, 2014

Tax Choices Shape Education Funding

Educational funding continues to be a major theme in this fall’s election campaigns. It is worth noting how school funding has historically been affected by economic trends and tax policy choices.


Over the past 25 years, the Legislature has generally allowed state aid for K-12 education to grow at the same rate as the Kansas economy, even if it required tax increases.  Following the Great Recession, however, Governor Brownback and the Legislative majority passed significant income tax cuts with the goal of boosting the state economy.  Although total state school aid has increased, the income tax cuts have also lowered state education funding relative to Kansans' personal income.


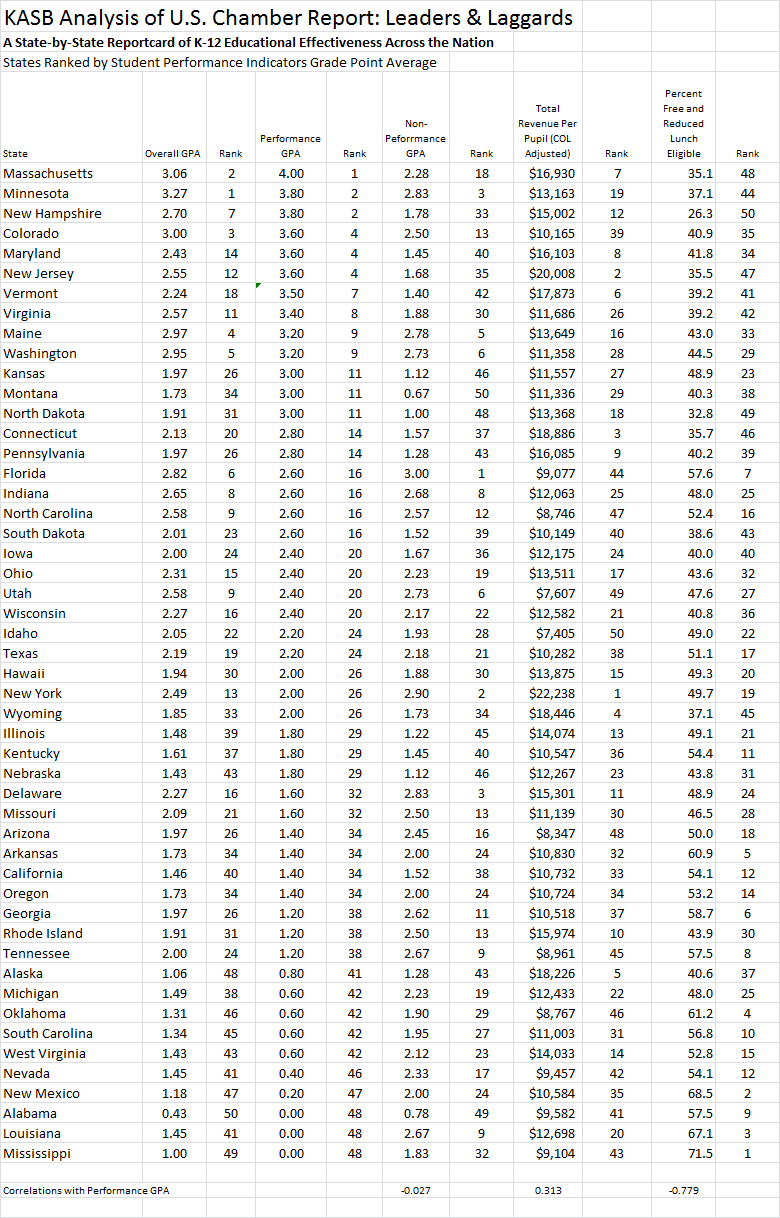
KASB has released a new report showing that states with the highest student achievement levels tend to spend more money per pupil, raising concerns that less funding for education will make it harder to prepare students for successful postsecondary education and careers.


History of State General Fund Budget and School Funding


The chart below shows 25 years of historical data, and future projections through 2019.  In 1990, total State General Fund spending (red line) was about $2.4 billion, slightly more than SGF revenues (green line).  Total state aid to school districts (which excludes federal aid and local revenues) was just under $1 billion, or less than 40% of the state general fund (blue line).


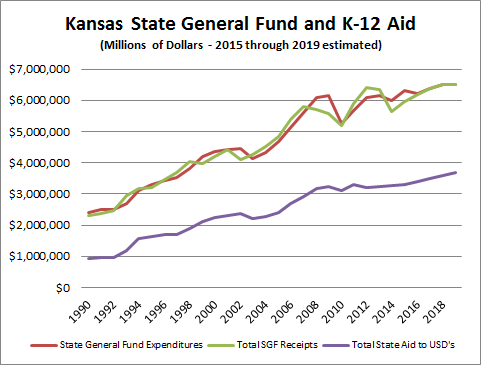
In 1992, the Legislature raised state sales and income taxes to increase school state aid by over 50%.  Part of this increase resulted in higher school spending, but part of the increase was to “equalize” local property taxes for schools by reducing tax rates in lower wealth districts through more state aid.  As a result, K-12 state aid increased to about 50% of state general fund expenditures, where it has generally remained ever since.


During the healthy state and national economy of the 1990s, state tax revenue and spending grew steadily.  State school aid also increased significantly, although as in the early 1990s, not all of the increases went to higher school budgets.  Hundreds of million of dollars were used to further reduce property taxes, dropping the statewide levy from 35 to 20 mills.


After a decade of solid growth, state revenues dropped in 2002 during the post-9/11 recession, resulting in a cut in school aid in 2003. To avoid further cuts, the Legislature increased certain taxes in 2002.  Combined with a strong economic recovery, state revenues grew from $4.1 billion in 2002 to $5.8 billion in 2007.  This allowed the Legislature to comply with the Supreme Court’s 2005 Montoy decision without raising additional taxes.  K-12 aid increased approximately 50% between 2003 and 2009, from $2.2 billion to $3.2 billion.


There trends changed dramatically as a result of the Great Recession.  From 2007 to 2010, SGF revenues dropped $600 million, or over 10%.  General fund expenditures dropped even more, from nearly $6.2 billion in 2009 to $5.3 billion in 2010. To avoid even deeper cuts in state programs, the 2010 Legislature passed a one-cent increase in the state sales tax for a three-year period.  The additional sales tax revenue, combined with a recovering state and national economy, allowed general fund revenues to rebound to $6.4 billion in 2012.


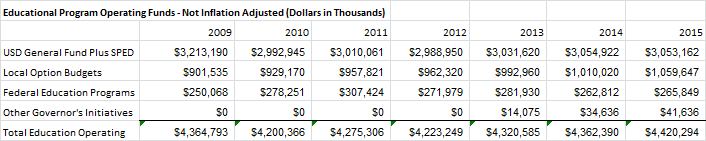
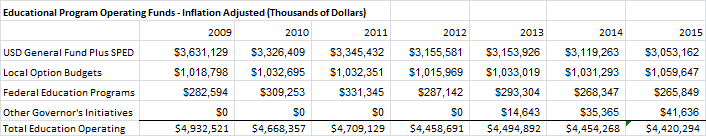
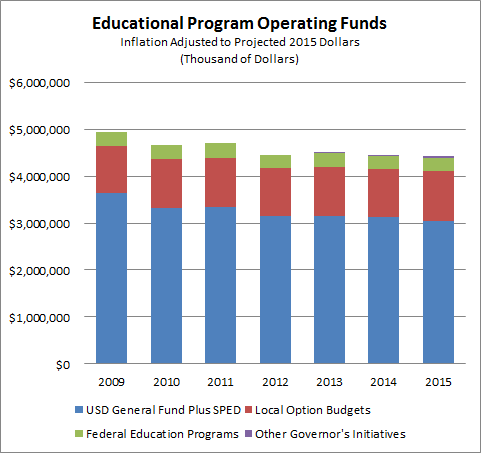
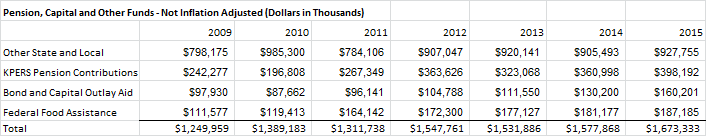
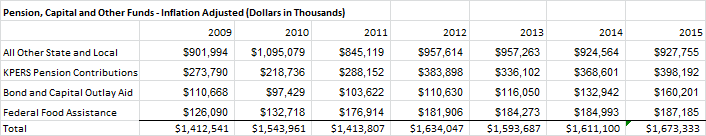
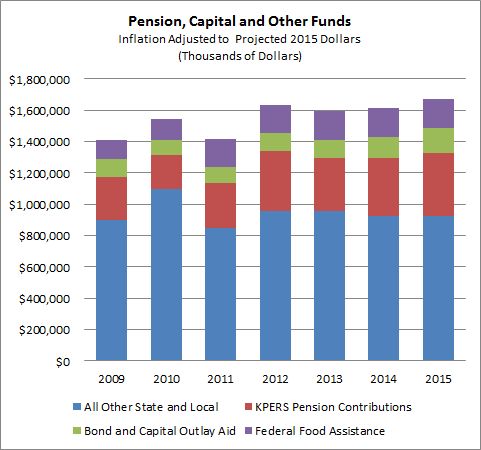
During these gyrations in the state general fund, K-12 school aid dropped $130 million from 2009 to 2010, but the reduction would have been much greater without $477 million in federal stimulus funding spread over 2010 and 2011.  (These federal dollars are included in K-12 state aid in the chart above, but not in the state general fund.)  Total K-12 state aid remained relatively flat during from 2009 through 2013, averaging about $3.2 billion.  During this period, inflation and student enrollment increased, and funding for KPERS pension payments and bond and interest payments rose, while funding for general operating costs declined.


Based on previous history, state school aid would have risen as the economy improved.  However, in 2012, the Legislature approved and the Governor signed a major income tax rate reduction that cut state revenues by an estimated $231 million in 2013 and $495 in FY 2014.  (The 2014 reduction would have been over $800 million if the Legislature had not approved an extension of the higher sales tax rate and other revenue changes.) The Governor and Legislature also supplemented school funding by using state highway fund dollars for school transportation aid and expanded lottery revenues for KPERS funding.


Projections for Future Years


State general fund revenues and expenditures for 2015 through 2019 on the previous chart are based on projections from the Kansas Legislative Research Department, and assume both “normal” economic growth and the impact of future tax cuts already approved by the Legislature.  Under these assumptions, state general fund revenues will continue to grow, but more slowly than the overall state economy.  (That is the whole point of the tax cuts - to collect a smaller share of income for governmental programs and allow individuals and business to keep and spend more.)


K-12 state aid for 2015 through 2019 is also based on the KLRD projections.  It assumes the Legislature will fully fund the appropriated school aid budget levels for 2015, add $50 million each year for state and school district KPERS pension contributions, and add over $50 million each year for general state school aid for enrollment increases or other costs.  In addition, KLRD estimates also show that the state will have to add between approximately $70 million and $80 million each year for human service caseloads.


Based on projected revenue available, after making the additions previously listed, the Legislature will have to REDUCE spending by nearly $250 million in 2016, $25 million in 2017, $38 million in 2018, and $181 million in 2019 to avoid an unconstitutional deficit in the state general fund.  If any of these reductions are applied to school finance programs, the level of state aid shown above will drop.


The current KLRD projection indicates that state spending and school district aid will continue to increase, but at a slower rate.  However, the school funding increase will only occur IF the state can deal with anticipated overall SGF funding shortfalls WITHOUT reducing school aid.


State Spending and K-12 State Aid Compared to Kansas economic growth


Another way to look at the impact of state budget choices is to compare these trends to the overall in the Kansas economy.  Kansas personal income is a widely accepted economic measure of the total income of all residents from all sources.  Comparing state general fund revenues and expenditures and state aid to total Kansas personal income shows the percentage total taxpayer income going to state programs funded by the SGF, as well as to state aid for public schools.  (Note: the chart below does not include federal and local school revenues.)


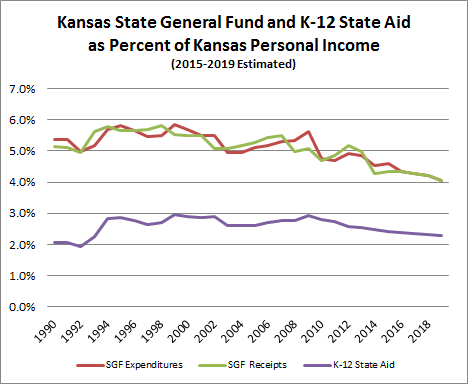
This chart indicates the state general fund and state aid to K-12 schools increased relative to total personal income income in 1993 and 1994 as the school finance system was changed, then remained quite constant until the 2002 recession.  After declining compared to Kansas personal income in 2003 and 2004, both the state general fund and K-12 state aid gradually climbed back up to 1990s levels.  Since 2009, however, both the state general fund and K-12 state aid have dropped significantly compared to the overall state economy.


This shows Governor Brownback and the current Legislature have made a very different choice than has been done in the past.  Instead of increasing state general fund revenues to allow K-12 education funding to keep up with the overall state economy, current projections indicate the share of state income going to state education aid will drop to the lowest level in at least 20 years, and will continue to fall for the foreseeable future.


Consequences of tax and budget policy on school funding


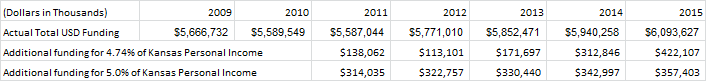
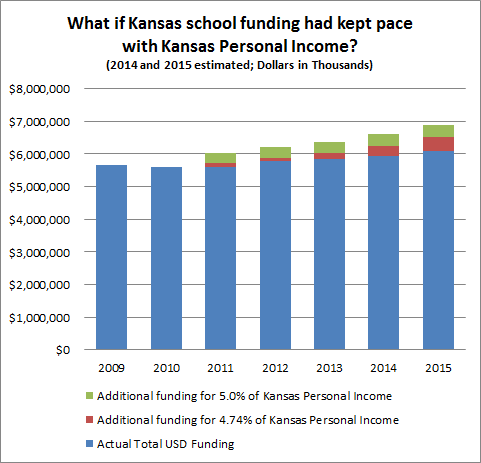
The Governor and his supporters note that total state aid for K-12 education has increased since his first budget, and is projected to continue to rise - although he has offered no specific plan to deal with projected SGF deficits.  However, state aid would be much higher if Kansas had continued to provide the same level of support compared to taxpayer income as has been done in the past two decades.


Specifically, had state aid been funded at 2.7% of personal income (the average since 1994) rather the projected 2.4%, school districts would be receiving over $400 million more in state aid this school year.  That is enough to raise the base per pupil by nearly $600.  In program terms, it could entirely fund the Governor’s all-day kindergarten program, expand other early childhood programs, restore teaching positions that have not been replaced since 2009, add school career counselors and other services, and expand technical education programs.


Governor Brownback says the income tax cuts will cause a significant improvement in the state’s economic growth.  The income tax cuts have reduced the revenue available for education, especially in operating budgets.  As noted earlier, KASB has released a new report showing that states spending more on education tend to have higher student achievement - and that Kansas is already an “overachiever” in terms of results for the money spent.


The Governor and his supporters say the tax cuts will create more jobs and economic opportunity for Kansans when they leave the school system. They indicate school funding has increased in recent years, if not as much as most school leaders would like, and that an improving economy will ultimately allow graduates to find jobs in Kansas and provide additional revenue to fund schools.


The Governor’s opponents say the tax cuts have not caused any more economic growth than the state experienced under the previous tax structure, but have hurt the ability of school districts to ensure high school graduates leave school with the skills to take advantage of economic opportunities.  They fear the state’s budget situation will require either further reductions in school funding and quality or higher local property taxes - or both.


Which of these visions most voters believe will likely determine their choice for Governor and their Legislators.

Friday, October 10, 2014

The Gannon Decision: Funding and Student Achievement

At some point in the next few weeks or months, a three-judge panel is expected to rule on the “adequacy” of Kansas school funding. It is worth reviewing the standards the Kansas Supreme Court established for that decision, and what it might mean. There is strong evidence reaching the standards for adequacy set by the court will require additional funding.

A March 12 memo on the Gannon case prepared by the Legislature’s own legal staff, in the Office of Revisor of Statutes, reads in part:

….[T]he Court reaffirmed its prior decision that Article 6 of the Constitution of the State of Kansas (Article 6) contains an adequacy component with respect to determining whether the Legislature has met its constitutional obligation to “make suitable provision for finance of the educational interests of the state.” The “adequacy component is met when the public education financing system provided by the legislature for grades K-12-through structure and implementation-is reasonably calculated to have all Kansas public education students meet or exceed the standards set out in Rose [v. Council for Better Educ., Inc., 790 S.W.2d 186 (Ky. 1989)] and presently codified in K.S.A. 2013 Supp. 72-1127.” These standards now form the basis for the test to determine whether the Legislature has adequately provided funding for education. The Court then remanded the case back to the district court with directions to apply the newly established adequacy test to the facts of the case.

The Court clearly stated funding provided for schools must be adequate to give students a reasonable chance to meet the Rose Standards adopted by the Legislature. Those standards refer to seven “capacities” for students to be successful, including communications skills, understanding political and economic systems, physical and mental health, appreciation of arts and cultural heritage, and preparation for success in academics, vocational-technical training and the workforce.

Is the school finance system currently giving all students a chance to meet these standards? While there are many aspects of the Rose Capacities that are not uniformly assessed, there is clear and consistent information on basic reading and math skills, preparation for postsecondary education and high school completion, which is an indicator of both preparation for postsecondary education and employment. Consider the following:

  • About 80 percent of Kansas students scored at basic and 40 percent at proficient on the National Assessment of Educational Progress (NAEP) reading and math tests, the highest ever and ranking Kansas in the top 15 states. However, that means one in five students still falls below a basic standard indicating the student is likely to graduate high school, and 60 percent fall below a proficiency standard that indicates progress to “college ready.”
  • Thirty-one percent of students meet all four college-ready benchmarks on the ACT test as juniors or seniors, the highest percentage ever and one of the top marks for states where most students take the ACT. However, over 60 percent of future jobs are expected to require some kind of postsecondary credential, technical or academic.
  • Eighty-five percent of Kansas students graduate from high school in four years, but 15 percent may never finish. Failure to complete high school means dramatically higher unemployment and lower income.
These statistics indicate that while Kansas does very well compared to most other states, too many Kansas students are NOT reaching the capacities defined by the Rose standards. The question is: will more money make a difference? There are at least three reasons to think it will.

First, remember each of these achievement levels is at an all-time high. Kansas has never had better results spending less money and has never had more high need, low income students.

Second, as funding increased in recent years, student achievement increased at a similar or higher rate after adjusting for inflation, employee compensation and enrollment growth, as described in a previous post. Moreover, the last comprehensive educational cost study on student outcomes conducted by the Legislative Post Audit Division found a nearly one-to-one correlation between funding and outcomes.

Third, KASB research shows no other states get consistently better results unless they spend more money, have fewer low income students, or both. On virtually every measure of state education achievement, higher state spending has a positive correlation with student outcomes related to the Rose Capacities. In fact, Kansas is already an “over achiever,” with better student outcomes than expected for the amount of spending per pupil (below the U.S. average or median) and the percentage of low income students (just below the U.S. average, higher than median).

Wednesday, October 8, 2014

Inflation and School Funding: Why Do Districts Need More Money?

In an blog post from August, I presented information from the Governor’s Budget Division and Kansas State Department of Education indicating that while K-12 education funding has increased since Governor Brownback took office and is higher than the pre-recession year of 2009, when adjusted for inflation funding has been flat for the past four years and educational operating budgets, which exclude pensions contributions, capital cost, debt service and food service programs, have been declining since 2009.

This has prompted several questions. Why use 2009 as a base year? How has school funding compared to inflation over a longer term? If school funding over the long-term has increased more than inflation, why do so many school leaders believe funding is inadequate?

First, I used 2009 as the base year because that was the earliest year referenced in new documents from the Kansas Division of the Budget.

Second, choosing a different year will give a different result. Another analysis using the same methodology used in my blog indicates school funding has increased at least $339 million MORE than inflation since 2005, using my definition of educational program budgets.

A $339 million increase on a $3.3 billion base is about 10 percent. Spread over 10 years, that is an average of about 1 percent per year more than inflation. In fact, I have found that the annual per pupil district operating budgets (general funding, special education state aid, local option budgets and federal aid, but excluding KPERS pensions, buildings, equipment, debt service and other local revenues) have averaged about 1 percent more than inflation all the way back to 1990.

The key word, however, is averaged. I suspect most families who experienced a jump in income between 2005 and 2009 but took a pay cut for several years during the recession and haven’t had a pay increase that exceeded inflation in three or four years would not feel like they were getting ahead, especially if they have more family members to care for. This is exactly the situation of Kansas school districts.

School funding did increase significantly between 2005 and 2009. Remember, 2005 was the one point in the history of the state when the Kansas Supreme Court ruled that school funding was too low to provide constitutionally suitable education. If 2009 funding was unusually high, 2005 funding was constitutionally too low. But school operating budgets were cut in 2010, 2011 and 2012, and have been essentially flat every year since. (I also note in the blog that other parts of school districts budgets, i.e. retirement contributions, building and equipment costs and food service, have gone up in recent years, which contributes significantly to total funding increases.)

Why do school leaders believe more money is needed, if over a 10-year period school funding is still ahead of inflation? To answer that question, we need to consider changes in educational costs.

First, by far the largest part of school operating expenditures is salaries and benefits, which tend to increase faster than inflation. According to the U.S. Bureau of Labor Statistics, private sector annual compensation has increased on average about 0.25 percent more than the consumer price index annual for the past 10 years. Districts have to increase salaries more than inflation simply to remain competitive with private sector employers.

Second, districts are educating more students. The number of full-time equivalent students increased from 441,868 to 460,848 since 2005, or 0.43 percent per year on average. Adding 0.25 percent for salaries and 0.43 percent for enrollment growth leaves just about one-third of 1 percent budget growth annually for “improvements” in operating education programs.

Third, “inflation” implies the change in the cost of getting the same product. For example, how does the cost today compare to cost 10 years ago for the same gallon of gas or a loaf of bread? Kansans are getting a better “product” from their public schools. Key educational indicators have increased at a rate equal to or higher than the 0.3 percent average funding growth left after subtracting inflation, net salary increases and enrollment growth.
  • The percent of students scoring at basic for Grades 4 and 8 reading and math on the National Assessment of Educational Progress increased from 76.0 to 79.4 between 2003 and 2013 - an average of 0.34 percent per year.

  • The percent of students scoring at proficient on the National Assessment of Educational Progress increased from 35.8 to 40.4 - 0.46 percent per year.

  • Percent of students tested by ACT meeting all four college-ready benchmarks (English, Math, Reading and Science) increased from 26 percent to 31 percent between 2006 and 2014: - an average of 0.6 percent per year.

  • The percent of students graduating “on time” from high school increased from 76.9 to 85.0 between 2003 and 2012 - an average increase of 0.9 percent per year.
On each of these indicators, the average annual growth improvement in student performance - though less than 1 percent per year - was equal to or greater than the average increase in educational program funding after adjusting for inflation, comparable private sector salary growth, and student enrollment growth. Remember, most of the funding increase occurred when this year’s high school seniors were in elementary schools. Yet it is often argued that Kansas educational performance has not increased fast enough to meet student needs or justify additional funding.

Not only have the outcomes changed, the students that are striving to achieve these outcomes have changed even more dramatically. For example, the percentage of school-aged children living below the poverty line increased from 12.7 percent in 2007 to 17.2 percent in 2013. The number of Hispanic student increased from 12.0 percent in 2007 to 17.8 percent in 2013. In both cases, this was a 50 percent increase in the number of students.

The percentage of students requiring English Language Learner programs increased even more, almost doubling from 5.5 percent in 2005 to 10.0 percent in 2013; and the percent of students on free or reduced meals increased from 38.5 percent in 2005 to 49.6 percent in 2013. Numerous state and national studies have found these students have more difficulties meeting academic standards for success.

Why do Kansas schools need more money if funding has exceeded inflation? Because employment costs, total enrollment and special needs students and student achievement goals are all increasing more than inflation.

Saturday, September 20, 2014

Tentative K-12 Commission recommendations, September 18-19

The K-12 Student Performance and Efficiency Commission made a series of recommendations over its two-day meeting on September 18-19. The commission worked from a memo of suggestions proposed by Chairman Sam Williams. Most of those items had been previously recommended by Governor Brownback’s School Efficiency Task Force or in testimony before the commission by KASB and other organizations. Here is a list of the commission’s decisions to approve, reject or defer action on these proposals. In most cases, the decisions were made by consensus. Actual votes are also noted.

Decisions Thursday:

Rose Standards
  • Agreed to ask the Kansas State Board of Education to establish measurable standards for determining whether districts are meeting the goal of providing students with the capacities adopted by the Supreme Court, Legislature and Governor, called the Rose Capacities. Requested that such measures be established by the beginning of the 2016 Legislative Session (in 15 months). Asked that a broad range of stakeholders, including employers, be included. Recommended by KASB.
  • Agreed to request the Legislature continue to fully fund district incentives for student completion of high demand technical education programs, and suggested the State Board consider other incentives for attainment of important state goals. Recommended by KASB.

School District Capital Expense Funding
  • Agreed to request a study of the “open-ended” obligation for bond and interest aid. It was stressed this recommendation would not eliminate equalization aid, but could require districts seeking state aid to receive state approval of projects based on demonstrated need. This demonstration of need would not apply to districts that do not receive state aid.
  • Determined the state had already broadened the definition of allowable capital outlay fund uses.
  • Agreed to recommend, but not require, that districts have long-term plans for operating and capital costs. This is expected to be included in a new accreditation system under development by the State Board.

Decisions Friday:

School District Cash Balances
  • Consensus to support the current two-year funding cycle for all state agencies, including school district state aid; but not a “rolling” cycle under which school budgets would always be approved two years in advance.
  • Consensus to support placing priority on timely state aid payments.
  • Consensus to support changing school district budget law to collapse most operating funds into the general fund and allow districts to carry cash balances in the general fund. This would eliminate most separate funds and their individual balances. Capital outlay and bond and interest funds would remain separate funds. (Presumably so would certain other funds such as federal aid.) School districts would continue to track expenditures by function or program, such as at-risk funding. The commission recognized this might require changes to school districts accounting procedures or requirements, which is also under study (see below).
  • On a 4-4 vote, the commission rejected a proposal to develop standards for how much cash carryover should be allowed in the general fund.

Professional Negotiations Act
  • Agreed that no review of teacher tenure is necessary as the due process law for school districts teachers was repealed by 2014 HB 2506.
  • No consensus on issue of replacing the teacher salary schedule with a salary range based on various criteria; determined this is a local issue under the Professional Negotiations Act.
  • Endorsed efforts underway by KASB, Kansas National Education Association, United School Administrators and Kansas School Superintendents Association to reach agreement by all parties on potential changes in professional negotiations. Commission expressed hope for successful results. Recommended by KASB.

Consolidation/Cooperation Initiatives
  • Recommended a study of district-level administrative personnel to investigate regionalization of administrative structures, such as already being done to some extent by regional services centers and other interlocal agreements. The definition of administration would include business functions and such areas as transportation, food service and maintenance. The commission specifically agreed by consensus to oppose mandatory district consolidation or boundary changes.
  • As part of that study, continue and consider enhancing incentives for district cooperation and consolidation. Recommended by KASB if incentives, not mandates.

School Management Expertise
  • Determined that the State Board already requires university level finance, accounting, and budget management course for district leadership license. Supports efforts by KSDE, KASB and others to provide assistance to district leaders.
  • Consensus to encourage and expect local school boards to have training in appropriate financial management and other board responsibilities. Recommended by KASB to be addressed by local board development plans as part of new accreditation system.

Spending on “Instruction”
  • Rejected idea of attempting to redefine spending on instruction under the current 65 percent policy goal because Kansas must use the federal definition of instruction.
  • Voted 6-3 to recommend repeal of the state policy goal of spending 65 percent of funds on instruction. Recommended by KASB.

Efficiency Assurance
  • Consensus to recommend creation of a task force to develop guidelines that would be used in district efficiency audits conducted by Legislative Post Audit. Such guidelines would be based on best practices to provide information to districts, but would not be mandatory for school districts to implement.
  • Recommend that the Legislative Post Audit Committee authorize an efficiency audit of the Kansas State Department of Education, primary to focus on state requirements for local districts.

Cost/Benefit Analysis
  • Consensus to recommend an analysis of the actual additional costs of new requirements and evidence of actual expected benefits before new state school laws or regulations take effect. Recommended by KASB.
  • Consensus to request school districts submit to KSDE suggestions of K-12 mandates that may be unproven or disconnected to performance.

Coalition of Innovative Districts
  • Consensus to encourage support of new innovative districts law.  Suggested that ideas for improving the law or providing more incentives for districts to participate should come from the Coalition of Innovative Districts Board. Recommended by KASB.

Transfer Due to School Closure
  • Decided a “cooling off” period when districts close a building before families can transfer to other districts or receive transportation services was unnecessary because of the commission’s actions in opposition to mandatory consolidation. Recommended by KASB.

Kansas Use Law
  • No support for making participation in the state use law for purchasing goods from organizations supporting the disabled permissive rather than mandatory.

Items Deferred to Next Meeting, October 8:

Student Data Management and Accounting System
  • Tentatively agreed to support a study on the costs and benefits of developing a statewide accounting and fiscal management system that would apply to both school districts and post-secondary educational institutions. It was not determined exactly what kind of data would be included. On Oct. 8, the commission is expected to hear from the two major vendors of district accounting software programs on the possibility of adjusting these programs and other systems used by the state’s largest districts to improve data management without building a new state system. In addition, two major school district auditors will discuss issues in uniform coding of district expenditures.

Efficiency Assurance
  • Tabled until next meeting a discussion of requiring all districts to have an efficiency or compliance audit over some period of time. At the next meeting, the committee will have discussion with school auditors on the costs of including more items in annual audits.

Special Education Hearings
  • Agreed to defer the issue of seeking to place limits on the duration of special education due process hearings to allow for a legal review of issues by commission staff.

Thursday, September 18, 2014

Kansas get high achievement marks on new U.S. Chamber Education Report Card

A new report from the U.S. Chamber of Commerce called “Leaders & Laggards: A State-by-State Report Card on K-12 Educational Effectiveness” gives Kansas average grades overall, but Kansas ranks much higher on actual educational outcomes. A closer look at the data finds that higher grades on the “policy” areas have no impact on performance, but states with higher funding per pupil tend to have better results. In addition, Kansas outcomes are better than expected based on both spending and percentage of low income students.

The report grades states on 11 areas, listed below. KASB assigned each area to a category based on either a performance measure or a policy measure. The letter that follows indicates Kansas' grade assigned by the new report. (Note: In most cases, all states are “graded on a curve” so the top 10 received an A, the next 10 a B, etc.)

Academic Achievement: Student performance on NAEP, including gains from 2005 to 2013. Performance. Kansas grade: B.

Academic Achievement for Low-Income and Minority Students: Student performance on NAEP, including gains from 2005 to 2013; disaggregated for African-American, Hispanic, and low-income students. Performance. Kansas grade: B.

Return on Investment: NAEP scores divided by state education expenditures, adjusted for cost of living. Performance. Kansas grade: B.

Truth in Advertising: Student Proficiency: State-reported proficiency rates compared with NAEP proficiency rates. Policy. Kansas grade: D.

Postsecondary and Workforce Readiness: Advanced Placement (AP) exams passed by the class of 2013, high school graduation rates, and chance for college at age 19. Performance. Kansas grade: B.

21st Century Teacher Force: Preparing, recruiting, and evaluating the teacher workforce. Policy. Kansas grade: D.

Parental Options: The market share of students in schools of choice, and two rankings of how hospitable state policy is to greater choice options. Policy. Kansas grade: F.

Data Quality: Collection and use of high-quality and actionable student and teacher performance data. Policy. Kansas grade: B.

Technology: Student access to high-quality computer-based instruction. Policy. Kansas grade: C-.

International Competitiveness: State scores on NAEP compared with international benchmarks, and AP exams passed by the class of 2013 on STEM (science, technology, engineering, and mathematics) and foreign language exams. Performance. Kansas grade: B.

Fiscal Responsibility: State pension funding. Policy. Kansas grade: F.

KASB converted the grades for every state into a number (A=4, B=3, etc.) to provide a traditional grade point average. Across all 11 measures, Kansas was just below a C (1.97) and ranked 26th of the 50 states. However, when considering just the five performance measures - in other words, looking only at actual student outcomes - Kansas’ G.P.A. jumped to 3.0, tied with two other states at 11th in the nation. The Kansas “policy” G.P.A. was just 1.12, or 46th in the nation.

That raised a question: why does Kansas do so well on student performance and so poorly on policy if those policy areas are important to educational effectiveness? It turns out those six policy indicators really have no relationship to performance. The “correlation coefficient” between state “performance” grade point average and “policy” grade point average is -0.027, meaning there is no statistically significant relationship between the two. (Remember, a 1.0 correlation is perfect one-to-one positive relationship; and a -1.0 is a perfect opposition relationship.)

In other words, states that received high marks in things like “truth in advertising student proficiency,” teacher evaluation systems, parental choice options, and well funded pensions were no more likely to have high student performance than low graded states.

On the other hand, funding DID make a difference. The correlation coefficient between a state’s performance grade point average and the total revenue per pupil (adjusted for regional cost differences) was a modest but positive 0.313. States that spend more per pupil are more likely to have high achievement than lower spending states. Moreover, higher spending per pupil has a significantly greater correlation with higher achievement than the policies graded by the Chamber report. (0.313 for funding vs -0.027 for policies.)

As is true in other reports, an even more significant impact on state achievement is the percentage of low income students. There is a -0.779 correlation coefficient between performance and the percentage of students on free and reduced price meals. That means it is highly likely that the more low income students a state educates, the lower its performance grade will be.

As the K-12 Performance and Efficiency Commission continues its work, it is noteworthy to compare Kansas performance on this particular scorecard with the money it spends per pupil and the characteristics of students in Kansas. Tied at 11th in performance, Kansas’ adjusted spending ranks 27th (meaning 26 states spend more) and the percentage of free and reduced lunch students ranks 23rd (meaning 22 states have more low income students and 27 states have fewer).

In fact, as the table below shows, only two states (Colorado and Washington) have the same or better performance G.P.A. and no state with more low income students has the same or better performance.


Monday, August 11, 2014

Facts about Kansas school funding: up, down or flat?

New facts about changes in Kansas school funding: up, down or flat?

As the 2014 election campaign heats up and school boards adopt budgets for the current year, KASB has been receiving more and more questions about what has really happened to Kansas school funding in recent years.

Questions about school funding will continue to grow because the Kansas Supreme Court has held the test of constitutionally adequate funding is the so-called “Rose” standards for preparing students to be successful in their lives beyond high school.  Before the state can decide how much money is needed to reach those standards, there must be an agreement on what we are already spending.

To help answer this question, we started with two documents the Kansas Budget Division - which is headed by Governor Brownback’s budget director - recently posted on its website.  First is the budget Comparison Report. This document reflects final Legislative action on the state budget for the the fiscal year that ended June 30 and the current fiscal year that began July 1.  Page 60 contains a chart showing state aid programs for K-12 education, including federal stimulus funding during the recession years, from Fiscal Year 2010 to the current year FY 2015 (2014-15 school year).  Page 62 contains a chart showing state and federal funding for FY 2013 through FY 2015.  The second document is a spreadsheet entitled State and Federal Support of Elementary and Secondary Education in Kansas, which covers the years from 2009 to 2015.

There are two major differences between these reports.  The Comparison Report shows the shift of the 20 mill statewide levy from local revenue to state aid, which indicates that state aid increased 23 percent from last year to this year.  The second document does not (as of August 3) show that change, which indicates total state and federal support increased just 4.6 percent this year.  The second document also includes funding for Governor Brownback’s initiatives that impact K-12 students and districts but are not under the Kansas State Department of Education or included in district budgets: secondary technical education tuition funding through the Board of Regents and funding for the Read to Succeed program, Reading Roadmap and Jobs for America’s Graduates under the Department of Children and Families.

Missing from both of the documents is local school district funding.  To show total changes in total school funding, KASB used total school district expenditure levels as provided by KSDE for 2009 through 2013, and KASB estimates for 2014 (final actual spending is not yet reported) and 2015 (budgets are not yet adopted) to develop the following data.  (NOTE: All numbers in these tables and charts are in thousands of dollars.)


Several items stand out.  First, total school district support declined from 2009 to 2011 during the Great Recession.  Second, total funding has risen each year from 2011 to 2015.  Third, funding from the state general fund - the state’s general purpose “checkbook” of revenue from income and sales taxes - has remained essentially unchanged for five years even though the state economy has recovered, largely because state income tax cuts have reduced available revenue.  Fourth, other state funding and federal funding increased from less than $500 million in 2009 to $850 million in 2014, largely because of federal stimulus funding in 2010 and 2011, and the use of state highway funding and expanded lottery revenues for education programs in 2014.

Because the statewide 20 mill levy will be collected by the state, rather than local districts, beginning in 2015, it produces a major increase in “other state and federal funding.”  However, this change does not provide an increase in total school funding, because the 20 mill revenue disappears as a local revenue source.  Finally, other local revenues are expected to decrease by about $20 million in 2015 because fully funding local option budget state aid will reduce LOB property tax requirements in many districts.  These changes are displayed graphically below.


This data shows that school funding has increased every year during Governor Brownback’s administration.  However, when adjusted for inflation, the picture looks somewhat different.  KASB used the state’s April Consensus Revenue Estimate predictions for changes in the consumer price index in 2014 and 2015, and then adjusted previous years’ funding to projected 2015 dollars.

As the following chart shows, when adjusted for inflation, total K-12 revenue has been essentially flat for the past five years, and is still below 2009 and 2010 levels.


Total revenues by source, however, does not explain how funding has changed for different programs within district budgets.  In fact, most of the increase in school funding has not been available for “this year” expenditures for teachers, administrators, and support staff positions or salaries, or other annual operating costs.  Instead, most of the increase has gone to pension and building costs.

Most funding for operating costs is in four areas that make up about 75 percent of total school budgets.  First is the school district general fund, determined by the base state aid per pupil multiplied by student enrollment as adjusted with pupil weightings, plus special education state aid.  Except for a few minor local revenues, this is funded entirely by state aid and the 20 mill statewide levy.

Second is the local option budget, funded by local property taxes, and in about 80 percent of districts, by state LOB aid based on the district’s per pupil property wealth. Third is funding for federal educational programs like special education and Title I (No Child Left Behind), but excluding student meal support and federal stimulus funding that was included in the general fund and LOB funding.  Fourth, we included funding for Governor Brownback’s technical education and reading initiatives.


In actual dollars, school district general funds and special education aid have been reduced by about $160 million, but local option budgets have increased by about the same amount.  Federal education programs increased about $15 million, and funding for the Governor’s targeted programs increased by about $40 million.  As a result, net funding for these programs, after dropping over $200 million in 2010, in 2014 recovered to about the same level as it was six years ago.

When adjusted for inflation, however, as the following table and graph show, the state’s base support for K-12 education through school district general fund budgets has declined almost $500 million, and Local Option Budgets did no more than keep up with inflation until 2015, when the Legislature increased the maximum LOB districts can adopt.  Federal education program funding declined $15 million during this timeframe.


These figures illustrate why school leaders continue to express deep concerns about the adequacy of school funding, despite increases that have been provided in certain areas.  When measured against changes in the cost of living, funding for educational programs that can actually be spent on teachers, administrators and student support programs has declined by $500 million since 2009, and even the increases in these areas provided by the 2014 Legislature for 2015 will be less than the projected rate of inflation.


The remaining one-quarter of total school funding looks much different.  This includes KPERS pension contributions made by the state for local school employees, which pass through school budgets but cannot be used for regular operating costs or current salaries.  In response to significant underfunding in the state retirement system, the state increased this funding by over $150 million in the past six years.  Second, state aid for bond payments and capital outlay for low property wealth districts increased by over $60 million.  Third, federal food assistance to support free- and reduced-price meals for low income students increased by over $70 million.

The final and largest area is “all other” state and local funding, primarily school district payments for capital costs and debt service: building, remodeling, equipment and bond payments, which increased $230 million.  (This area also includes the costs of “paid” student meals.)


These increases are reduced when adjusted for inflation, as the following table and chart shows:


This data hopefully clarifies some of the competing claims about school funding.  Total school funding has been increasing in real terms, but has essentially been flat when adjusted for inflation.  Within total budgets, support for current educational costs - salaries for teachers, administrators and student support positions and other student services - has been declining, while funding for student meals and long-term costs for buildings and retirement pensions has been increasing.

School districts have very little control over these budget trends.  The district general fund (base per pupil and weightings), special education aid, KPERS funding and all federal funds are determined at the state and federal level.  The state caps the amount of LOB and capital outlay funds that can be raised.  Just about the only part of the budget entirely controlled at the local level are construction bonds, which must be approved by local voters.

A final comparison is to see what might have happened if school funding had followed the state economic recovery.  Since 1990, total school funding in Kansas has averaged about 4.74 percent of total personal income in the state, which is the annual income of all Kansas residents.  In 2009 and 2010, it was over 5 percent, as a result of additional funding provided after the Kansas Supreme Court Montoy school finance decision found that the state was not providing constitutionally suitable finance, and a drop in personal income during the Great Recession.


However, as the state began to recover from the recession, school funding has fallen behind growth in personal income.  Based on the Consensus Revenue Estimate projection for personal income growth in 2014 and 2015, KASB estimates total personal income will have increased 25 percent from 2009 to 2015, but K-12 funding will have increased less than 8 percent.  Total funding would be $422 million more next year if equal to the historical average percent of total Kansas personal income (4.74 percent), and over $750 million more if the level reached after the Montoy settlement had been maintained (5 percent).


If even the lower revenue level was available, the Legislature could have come close to funding the base budget per pupil at the previously approved level of $4,492, at a cost of $440 million.  At the higher level, the state could also have funded all day kindergarten for all students, expanded preschool programs and provided other educational enhancements to help meet the new Rose standards for successful students.