
School leaders, educators, parents and the public can easily get confused about the real state of school funding in Kansas. Districts leaders talk about budget cuts. Property taxes are increasing in many districts. Class sizes are larger than they were several years ago. Yet many Legislators and organizations like the Kansas Policy Institute point out that school funding is at an all-time high. What is really going on?
Recently, a very active and informed school board member sent me a chart she received from a friend. She wanted to be able to understand, explain, and respond to the information it contained. Here is the chart:
Recently, a very active and informed school board member sent me a chart she received from a friend. She wanted to be able to understand, explain, and respond to the information it contained. Here is the chart:

This appears to be a chart prepared by the Kansas Legislative Research Department and updated annually. It shows basic trends in Kansas school funding. Here’s a caution when looking at this chart:
- The top blue line (the line at the very top of the chart) shows total per pupil funding from all sources, which means not just state aid, base budget per pupil, or general funds and local option budgets. It also includes all federal funding; state KPERS contributions (which is a “pass through” for district budgets); capital outlay expenditures and repayment of constructions budgets; and all other spending from local sources, such as fees for meals, textbooks, transportation, etc.This total for all school districts in the state is divided by the Full Time Equivalent (FTE) enrollment statewide of over 450,000 students, which has been increasing over the past decade. According to this data, which comes from the Kansas Department of Education based on local district budgets, total per pupil funding increased from $9,485 in 2003-04 to an estimated $12,628 last year (2012-13 school year). The actual expenditures for last year and a new estimate for the current year (2013-14) will be released this fall.
- The bottom four lines are not per pupil spending but instead are total spending and funding, with amounts in millions. (It is easy to assume the amounts are per pupil because of how they are represented, but that is not the case.)
- The top brown line is total spending from all sources, increasing from $4.2 billion in 2003-04 to $5.76 billion last year.
- The three bottom lines are the three major revenue sources within that total: state aid (green), local revenue, including property taxes, fees and any other sources (red) and federal aid (purple).
The chart shows total state aid increased by more than $1 billion between 2004 and 2009, primarily as a result of the Montoy school finance case. State aid dropped by about $400 million in 2010 as a result of the Great Recession, but has recovered about $300 million of that loss. Federal aid “bumped up” in 2010 and 2011 as a result of federal stimulus funding, but dropped back down after that aid expired. Overall, this shows that school spending both per pupil and total dollars rose significantly in between 2005 and 2009, and has been essentially flat since then.
The information is useful in a number of ways, however it does not contain several important facts when seeking to understand school spending and funding; first, the impact of inflation, and second, changes in how districts can spend the money they receive. KASB prepared to following chart to provide that additional information. This chart provides per pupil amounts adjusted for inflation by converting previous years to 2013 dollars. (The formula used divides the consumer price index for the previous year by the CPI in 2013, and multiples the result by the previous year dollar amount.) Rather than looking only at the source of revenue, this chart divides spending into five major budget categories.
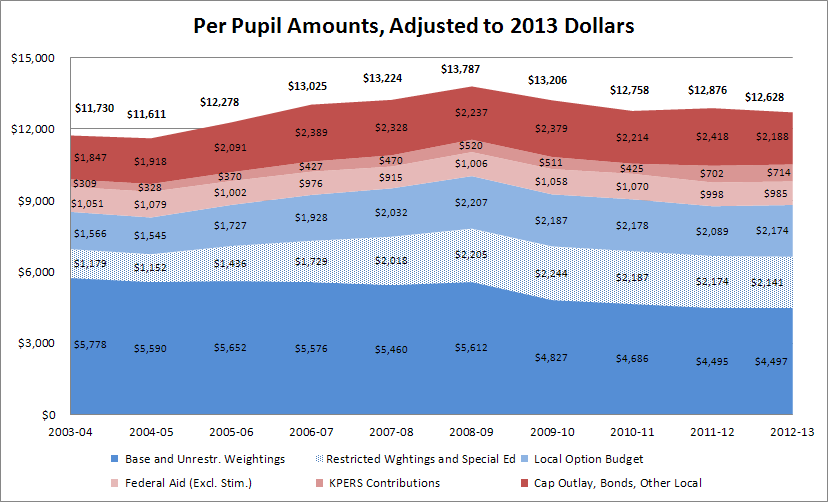
Total. Adjusted for inflation, total per pupil spending in 2004 was $11,730, over $2,000 higher than the actual amount of $9,485. Total spending per pupil last year was less than $900 higher than the same spending in 2004 when adjusted for inflation. The equates to about 7.7 percent - an increase of less than one percent per year. Moreover, total spending last year was over $1,000 per pupil lower than in 2009 when adjusted for inflation.
General Fund (Restricted and Unrestricted). Even more significant is the fact that base aid per pupil and “unrestricted” weightings that can be used for just about any general education purpose have declined from an inflation-adjusted amount of $5,770 in 2004 to $4,497. “Restricted” weightings, including special education aid, which are dedicated to specific program or mandated activities, have increased from an inflation-adjusted $1,179 to $2,141. This is a result of the Legislature increasing the amount of aid for these special needs programs and an increase in the number of pupils in these programs. These combined (base aid, unrestricted weightings, restricted weightings and special education aid) make up the school district general fund, which was over $300 lower in inflation-adjusted dollars than it was in 2004, and almost $1,200 lower than in 2009. This means districts not only have lower general fund budgets per pupil, they must spend more of those funds on special programs.
LOB. Local option budgets increased by an adjusted $641 per pupil between 2004 and 2009, in part because the Legislature increased the “cap” on LOB as a percent of the general fund from 25 to 31 percent. LOB funding has declined slightly since 2009. (LOB funding would have dropped even more if the Legislature had not allowed districts to use the 2009 base to calculate the maximum LOB.) Because the Legislature has not increased LOB state aid since 2009, when districts that are eligible to receive state aid increase their LOB, it pulls state aid away from other districts (even if they they are NOT increasing their LOB), which requires more local property tax to make up the difference.
Federal Aid. Adjusted for inflation, federal aid has remained almost unchanged over the past ten years, at approximately $1,000 per pupil. (For the above KASB chart, federal stimulus funds are included in base funding and local option budgets because they were used to offset state aid.)
KPERS. The only area of district budgets to increase in real terms since 2009 is the state contributions to the Kansas Public Employees Retirement System on behalf of school district employees. These funds have more than doubled since 2004, from an inflation-adjusted $309 to $520 in 2009 and $714 last year. The Legislature has increased KPERS contributions to address a significant actuarial underfunding of the state retirement system. Although these funds are included in school district budgets, they cannot be used for any other purpose.
Capital Costs, Debt, Other Local. The final budget area includes capital outlay expenditures for buildings and equipment, repayment of school district construction bonds, and all other local income such as food service, textbook and activity fees, and other special revenues. By law, none of these can be used for regular operating costs.
This information should explain why school districts are experiencing budget “cuts” even though funding has remained relatively “flat” since 2009 in actual dollars, not adjusted for inflation. In terms of actual purchasing power, total funding per pupil has declined by over seven percent over the past five years. The portion of school districts budget that can actually be used for general educational purposes, like teacher and support staff salaries, has dropped over 11 percent in real terms.
Considering all of this, inflationary adjustments are important. When fixed costs increase and actual dollars are flat, districts must either provide salary increases that are less than inflation, reduce positions, cut programs or a combination of all three. Although many districts have some ability to use cash reserves, these are one-time transfers that must be used cautiously, just as individuals cannot rely indefinitely on paying regular living expenses from savings.
Mark, thank you for putting this information out there. It helps us a great deal in explaining why cuts have been necessary. I will be sharing this information with my local board.
ReplyDeleteSteve Noble, Hillsboro