
Earlier this month, I posted a story about a new study from the Center for Budget and Policy Priorities (CBPP) about changes in state funding for K-12 education. Among the findings:
- Kansas had the fourth-deepest cuts in per pupil state funding between Fiscal Years 2008 and 2014 - 16.5 percent after adjusting for inflation. (14 states actually raised spending per pupil over the period, including regional states such as Minnesota, Nebraska, Iowa and North Dakota.)
- Kansas was one of only 15 states to cut per pupil state funding from last year to this year, and had the third-deepest pupil cut in the nation (2.6 percent). In the region, only Oklahoma cut spending aid per pupil this year.
Shortly afterwards, the Kansas Policy Institute (KPI) posted this story, arguing the CBPP report was "deliberately misleading;" citing three major objections:
- First, the CBPP report only considered state funding, which excludes other school district revenues. (State aid excludes federal funding and local revenues, which provide about 8 percent and 37 percent of total Kansas school funding, respectively.) KPI suggests revenue from the 20 mill statewide school levy and local option budget tax levies should be included as state funding because it is "provided through state authority."
- Second, while KPI agrees that total funding per pupil has decreased since 2009 compared to inflation, as KASB has previously discussed (see my blog post "What is the real state of Kansas education funding?"), it presents data showing total spending per pupil is still up about 33 percent over 1998.
- Third, KPI suggests that school districts could have made up for the lost of funding compared to inflation since 2008 if they had spent all operating funds received, rather than increasing cash balances.
- First, "a large part of this increase (in total funding) is a sizeable bump in state payments to the teacher retirement fund after years of underfunding left it in danger of not meeting its obligations. That money will help retired teachers but it won’t help schools offset the big state aid cut."
- Second, decreases in state funding have been somewhat offset by increases in local funding. "But these modest increases come nowhere close to offsetting the deep cuts in general state aid. And a shift in funding responsibilities from the state to localities tends to worsen funding inequities among school districts, since poor districts tend to have a much harder time raising local revenue."
KASB would offer these additional thoughts to this debate:
School Funding, Inflation and Taxpayer Support
The Kansas Policy Institute blog presents the following chart and explanation of inflation-adjusted school spending in Kansas:
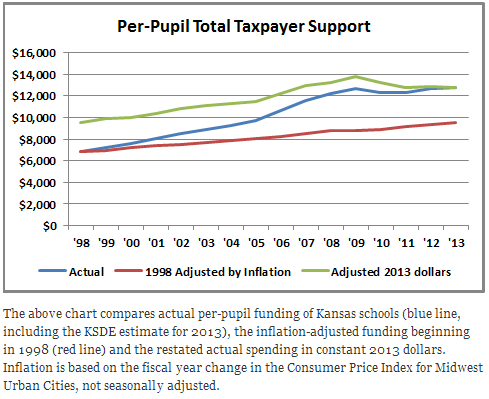
This chart indicates that over the past 15 years, per pupil funding from all tax sources has increased significantly more than inflation. However, so has taxpayer ability to provide that support. In fact, total personal income in Kansas has risen from $42 billion in 1989 to $67.8 billion in 1998 to an estimated $124.5 billion in 2013: an increase of nearly 200% while the consumer price index increased about 80%.
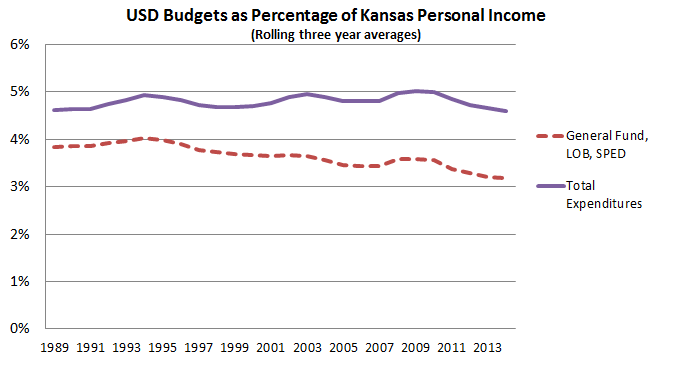
The following chart from KASB data shows funding for school district general fund budgets, local options budgets and special education state aid - which is essentially the state aid plus “state-authorized local aid” described above by KPI - declined from about 4% of Kansas personal income in 1998 to slightly above 3 percent in 2013. Total funding, which includes school construction and bond payments, capital outlay expenditures, KPERS contributions and other local revenues such as food service and student fees, has hovered at or just below 5 percent of state personal income for the past 25 years, but has been declining since 2009.
Kansas school spending has exceeded inflation for two major reasons. First, Kansas personal income has increased faster than inflation because income in the private sector has increased more than inflation. If schools are to compete for high quality employees, they need to keep up with overall wages and benefits. Second, spending has increased to improve quality and outcomes by adding personnel, positions and investments in new technology and professional development.
This chart also makes clear that the state’s contribution to education, even including KPI’s description of “state authorized local funding,” is declining both compared to the overall Kansas economy and as a share of school funding. The growing part of school funding are retirement contributions, building and equipment expenditures, food service and student fees. All of these are important expenditures with a long-term impact on school quality, but they cannot be used to reduce cuts in salaries, positions and programs.
Could schools have avoided these cuts by spending down cash balances?
Consider this example: five years ago, you made $50,000 per year. Your salary has been cut by $1,000 each of that last five years, so your current salary is $45,000. However, you’ve been worried about the future, so you tightened your belt and put $1,000 a year into savings, so you have $5,000 more “in the bank” than you did five years ago.
Suppose you had spent that extra $1,000 each year instead of saving it. Although you would have spent more each year, this year your income would still be $5,000 less than it was five years ago. Or, you could decide to spend the whole $5,000 THIS YEAR. Does spending $5,000 from savings AND $45,000 from salary mean your income hasn’t been reduced? Obviously not, because next year, you won’t have the money in savings and your income will still be $45,000.
It’s exactly the same for schools. Spending cash balances uses one-time money. Rather than increasing cash reserves, school districts might have reduced cuts year by year, but that only delays spending cuts. You can’t use savings to replace reductions in on-going revenues.
KPI offers the following chart to show the changes in school district July 1 cash balances in recent years.
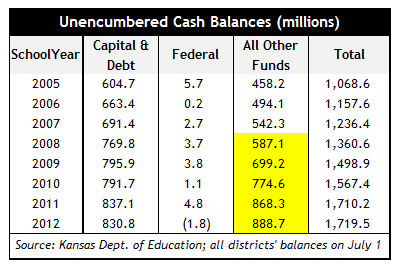
Excluding capital and debt and federal funds, the chart indicates cash balances increased by over $300 million. I took the annual increase in cash balances in this chart and added this amount to per pupil spending for the previous year. This indicates what could have been spent if no additional funding had been placed in cash reserves. I then compared that amount to both actual spending and spending adjusted to 2013 dollars.
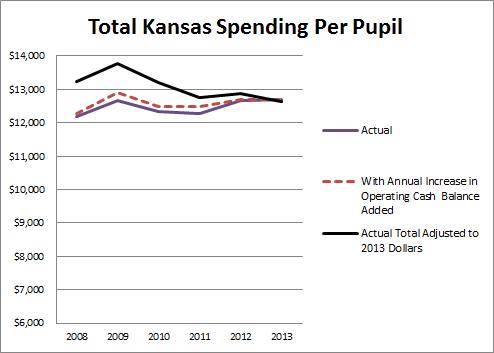
As the chart below indicates, this would have provided a slightly higher per pupil amount each year, but the benefit declines as districts stop adding money to reserves. (The Kansas State Department of Education has not yet released the July 1, 2013, balances so we don’t know if there was an increase for FY 2013.)
Conversely, what if districts had collectively spent the entire $300 million increase in reserves in FY 2013? It would have increased spending by approximately $650 per pupil last year. However, districts would have had to reduce spending by that amount in the current year, because they could not replace the use of one-time savings (unless districts used even more of their cash reserves).
Even if cash balances are considered, Kansas has experienced a real decrease in the per pupil funding compared to inflation. This is compounded by the fact that current operating funding for teachers, support staff and programs have been reduced even more, although funding for retirement contributions, capital costs and debt service has increased.
No comments:
Post a Comment
(Comments on this blog are moderated.)