
The report grades states on 11 areas, listed below. KASB assigned each area to a category based on either a performance measure or a policy measure. The letter that follows indicates Kansas' grade assigned by the new report. (Note: In most cases, all states are “graded on a curve” so the top 10 received an A, the next 10 a B, etc.)
Academic Achievement: Student performance on NAEP, including gains from 2005 to 2013. Performance. Kansas grade: B.
Academic Achievement for Low-Income and Minority Students: Student performance on NAEP, including gains from 2005 to 2013; disaggregated for African-American, Hispanic, and low-income students. Performance. Kansas grade: B.
Return on Investment: NAEP scores divided by state education expenditures, adjusted for cost of living. Performance. Kansas grade: B.
Truth in Advertising: Student Proficiency: State-reported proficiency rates compared with NAEP proficiency rates. Policy. Kansas grade: D.
Postsecondary and Workforce Readiness: Advanced Placement (AP) exams passed by the class of 2013, high school graduation rates, and chance for college at age 19. Performance. Kansas grade: B.
21st Century Teacher Force: Preparing, recruiting, and evaluating the teacher workforce. Policy. Kansas grade: D.
Parental Options: The market share of students in schools of choice, and two rankings of how hospitable state policy is to greater choice options. Policy. Kansas grade: F.
Data Quality: Collection and use of high-quality and actionable student and teacher performance data. Policy. Kansas grade: B.
Technology: Student access to high-quality computer-based instruction. Policy. Kansas grade: C-.
International Competitiveness: State scores on NAEP compared with international benchmarks, and AP exams passed by the class of 2013 on STEM (science, technology, engineering, and mathematics) and foreign language exams. Performance. Kansas grade: B.
Fiscal Responsibility: State pension funding. Policy. Kansas grade: F.
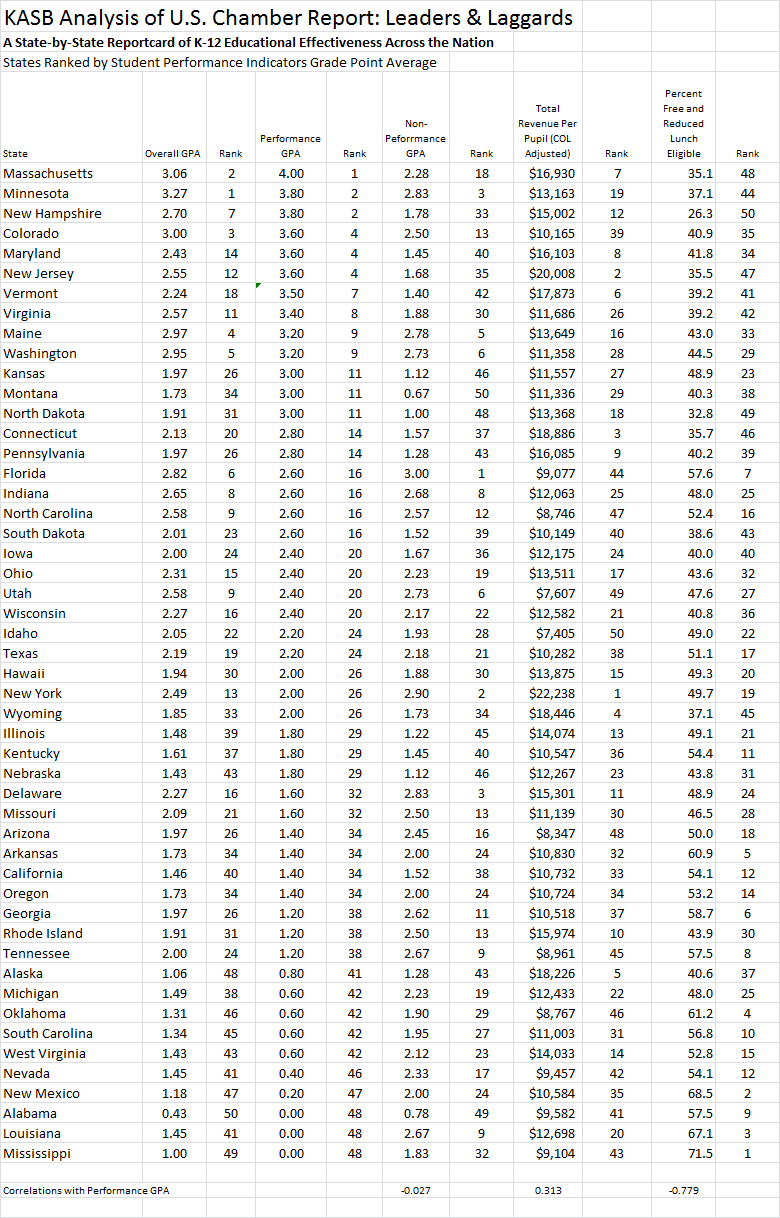
KASB converted the grades for every state into a number (A=4, B=3, etc.) to provide a traditional grade point average. Across all 11 measures, Kansas was just below a C (1.97) and ranked 26th of the 50 states. However, when considering just the five performance measures - in other words, looking only at actual student outcomes - Kansas’ G.P.A. jumped to 3.0, tied with two other states at 11th in the nation. The Kansas “policy” G.P.A. was just 1.12, or 46th in the nation.
That raised a question: why does Kansas do so well on student performance and so poorly on policy if those policy areas are important to educational effectiveness? It turns out those six policy indicators really have no relationship to performance. The “correlation coefficient” between state “performance” grade point average and “policy” grade point average is -0.027, meaning there is no statistically significant relationship between the two. (Remember, a 1.0 correlation is perfect one-to-one positive relationship; and a -1.0 is a perfect opposition relationship.)
In other words, states that received high marks in things like “truth in advertising student proficiency,” teacher evaluation systems, parental choice options, and well funded pensions were no more likely to have high student performance than low graded states.
On the other hand, funding DID make a difference. The correlation coefficient between a state’s performance grade point average and the total revenue per pupil (adjusted for regional cost differences) was a modest but positive 0.313. States that spend more per pupil are more likely to have high achievement than lower spending states. Moreover, higher spending per pupil has a significantly greater correlation with higher achievement than the policies graded by the Chamber report. (0.313 for funding vs -0.027 for policies.)
As is true in other reports, an even more significant impact on state achievement is the percentage of low income students. There is a -0.779 correlation coefficient between performance and the percentage of students on free and reduced price meals. That means it is highly likely that the more low income students a state educates, the lower its performance grade will be.
As the K-12 Performance and Efficiency Commission continues its work, it is noteworthy to compare Kansas performance on this particular scorecard with the money it spends per pupil and the characteristics of students in Kansas. Tied at 11th in performance, Kansas’ adjusted spending ranks 27th (meaning 26 states spend more) and the percentage of free and reduced lunch students ranks 23rd (meaning 22 states have more low income students and 27 states have fewer).
In fact, as the table below shows, only two states (Colorado and Washington) have the same or better performance G.P.A. and no state with more low income students has the same or better performance.
No comments:
Post a Comment
(Comments on this blog are moderated.)