
The Tallman Education Report comes from Hays, Kansas today as KASB begins its 2014 Advocacy Tour with a breakfast event, followed by a meeting at noon in Oakley. We will continue through western Kansas this week, in Liberal and Garden City tomorrow (Thursday) and Dodge City Friday.
Yesterday, I talked about a new report on high school graduation rates celebrating an all time high percentage of high school completion nationally. However, this good news was undercut by a second national report, the 2013 National Assessment of Educational Progress 12th Grade reading and math tests. Three things stand out.
First, national results are basically unchanged since the test was given four years before in 2009. That is different from the 4th and 8th grade NAEP reading and math assessments, which have shown upward movement nationally and in most states. One reason may be that the higher graduation rate means more students who previously would have dropped out are staying in school and being tested. In other words, flat scores can still indicate progress if schools are getting the same results when a more challenging group of students are included.
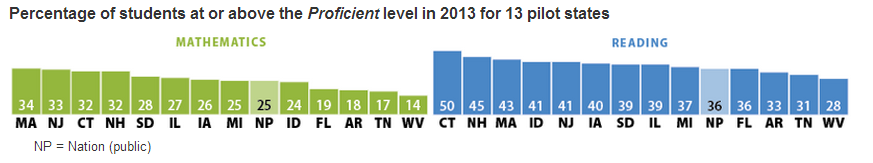
Second, only about one-fourth of students score at the “proficient” level in math and only one-third are proficient in English. I’ve found these results are roughly equal to the percentage of students meeting “college ready” benchmarks in the ACT and SAT. This indicates only about 25% of all students (not just those who take the ACT or SAT) are really ready for college level math and 36% for college level English. These levels fall short of national estimates that between 60% and 70% of future U.S. jobs will require some level of college education.
Third, these tests are another indication that the amount of state funding for K-12 education is linked to results. Unlike the 4th and 8th grade tests which are reported for every state, no 12th grade scores are released for most states, including Kansas. However, 13 states participated in 2013 on a pilot basis where a statistically reliable state results can be given. The results are shown in the chart below:
Because of the on-going to debate over the link between school funding and performance, we wanted to see if there is a relationship between the percent of students scoring at or above proficient (college ready) and total K-12 revenues provided in each state, based on the latest national data in Public Education Finance: 2012 from the U.S. Census Bureau.
To provide a common scale for comparison, we calculated each state’s test results and total funding as a percent of the U.S. average. For example, the chart shows that Massachusetts, which has the highest percentage of students scoring proficient or higher in math, is more than 30% above the national average. Revenue per pupil in Massachusetts in also more than 30% above the national average.
Here are the results for the mathematics test:
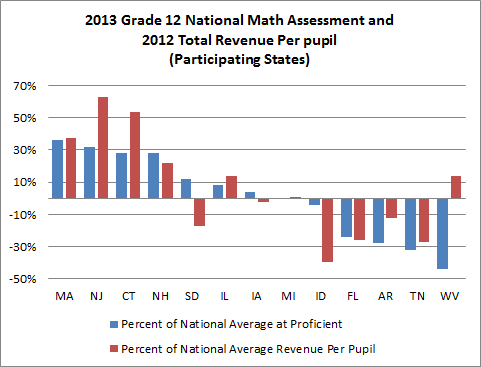
The chart shows a clear correlation between higher spending and higher achievement, and lower spending and lower achievement. Of the seven states with higher math achievement than average, all but South Dakota and Iowa also spent above average, and Iowa is very close the U.S. average in both achievement and spending. Michigan is even closer. On the other hand, of the five states with math proficiency below the U.S. average, all but West Virginia also spent below average.
There are other factors that affect student achievement - most significantly, the percent of low income students - but this data clearly shows that that highest achieving states on this assessments are more more likely to spend more per pupil; and lowest spenders are more likely to have lower achievement.
That's a challenge for Kansas, which spends BELOW the U.S. average.
"...higher graduation rate means more students who previously would have dropped out are staying in school and being tested" - Great insight, Mark, and one that is often overlooked when considering achievement measures.
ReplyDelete