
For nearly 35 years, Kansas consistently increased school funding more than inflation, which funded improvement resulting in higher educational levels. Since 2009, that has reversed.
A. Overall Kansas school funding has fallen behind inflation since 2009, and state and local operating funding has fallen even further behind.
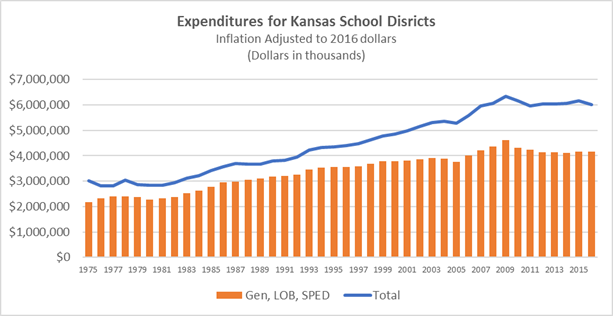
Although overall dollars are higher, when adjusted for inflation, total Kansas school funding is lower than 2009 and at the same level as 2007, and general operating budgets (general funding, local option budgets and special education state aid) is at 2006 levels – meaning no “real” (above inflation) increase in approximately ten years.
This ten-year effective funding freeze has occurred when enrollments have increased, especially for special needs students, and expectations for student achievement have risen.
B. Kansas funding has fallen behind other states, especially the highest achieving states.
Between 2008 and 2014, Kansas per pupil funding increased just 1.7 percent, less than one third of the national average of 6.2 percent. Thirty-seven states increased per funding more than Kansas.
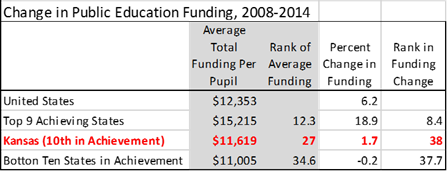
Over that period, the highest achieving states increased per pupil funding by 18.9 percent, while the lowest achieving 10 states cut funding by 0.3 percent.
C. State and national tests of basic skills, which are “early indicators” of student success, show signs of decline or stagnation, especially for students with special needs.
The State of Kansas argued in the Gannon case that the high and rising level of educational attainment in Kansas was evidence of funding as constitutionally suitable and adequate. The Supreme Court rejected that view for three reasons.
1. Recent educational indicators suggest that educational improvement is slowing and perhaps reversing.
The Supreme Court relied heavily on two types of assessments: state tests given to almost all Kansas students, but which were significantly changed in between 2013 and 2015, and the National Assessments of Educational Progress, which is given to small sample of students in Kansas and all other states.
State assessments
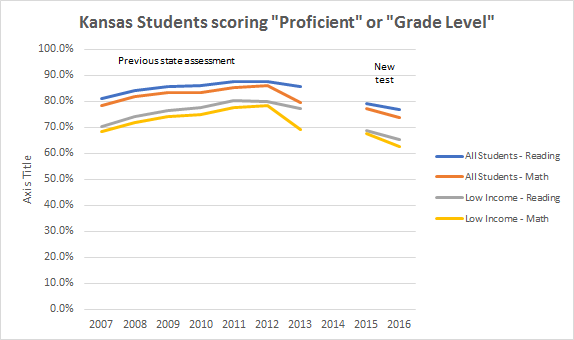
On the Kansas assessments since 2007, the percent of students scoring at the “proficient” level under the No Child Left Behind act rose steadily for all students and low income students until 2012.
However, performance levels dropped noticeably in 2013, the last year of the previous round of assessments. A new testing system was to begin in 2014, but because of technical issues no results were provided. Results for the new test, which used a benchmark called “grade level” comparable to the previous “proficient” began in 2015 and scores further declined in 2016.
National assessments
Kansas, like all other states since 2003, participates in the National Assessment of Educational Progress (NAEP), which tests a sample of students in reading and math at fourth and eighth grade in odd-numbered years. The “basic” level of NEAP is comparable the “grade level” benchmark on the new state assessments.
Beginning in the early 2000’s, Kansas NAEP performance increased through 2007, remained fairly level through 2011, and declined in 2013 and 2015. (Although NAEP allows comparison with other states and provides a longer timeframe than state assessments, which tend to change every few years, it has the limitation of being a much smaller sample size and only two grade levels.)
National Assessment of Education Progress: Percent of All KS Students At Basic or Above
2000/02
|
2003
|
2005
|
2007
|
2009
|
2011
|
2013
|
2015
| |
Fourth Grade Math
|
76
|
85
|
88
|
89
|
89
|
90
|
89
|
83
|
Eighth Grade Math
|
76
|
76
|
77
|
81
|
79
|
80
|
79
|
76
|
Fourth Grade Reading
|
68
|
66
|
66
|
72
|
72
|
71
|
71
|
68
|
Eighth Grade Reading
|
81
|
77
|
78
|
81
|
80
|
79
|
78
|
79
|
Average
|
75.25
|
76
|
77.25
|
80.75
|
80
|
80
|
79.25
|
76.5
|
Other indicators
Although state and national standardized tests have shown a decline in recent years, other indicators are more mixed. As noted above, educational attainment by young adults has continued to improve. The state’s “on time” graduation rate has also improved, and the percentage of students scoring “college ready” in all subjects on the ACT exam for prospective college students has increased. The concern is that declining performance at lower grades measured by state tests and the NAEP will begin to impact performance of older students as they prepare for graduation and college.
2. Too many Kansas students are not meeting expected educational outcomes, especially among certain groups.
The Supreme Court included the following table in the recent Gannon decision.
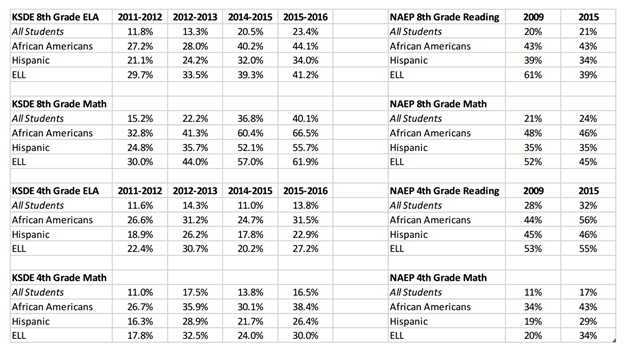
The chart shows the percentage of students NOT scoring at the “proficient” or “grade level” benchmarks on state assessments and the percent of students NOT scoring at basic on the NAEP in the overlapping grades and subjects. Note these percentages in the most recent years range from around 17 to 24 percent for ALL students, but are significantly higher for African Americans, Hispanics and English Language Learners.
These “achievement gaps” are consistent with other KASB reports showing that low income students, students with disabilities and other groups have lower graduation rates and NAEP scores.
3. These students are not randomly distributed across schools and districts; they are disproportionately students with circumstances that affect their success in school.
Most students who lag behind their peer and are “at risk” of failing to graduate are affected by circumstances outside of the school’s direct control, such as poverty, disability, illness, family issues, etc. (It is hard to do homework if you are homeless.) These factors are not evenly distributed.
No comments:
Post a Comment
(Comments on this blog are moderated.)