
In his 2014 State of the State Address, Governor Sam Brownback noted the people of Kansas provide over $12,500 per K-12 student, or about $250,000 for a classroom of 20. What is that money being spent on? More important, what are Kansans receiving for that investment?
Start with the teachers. Thanks to efforts to keep classes small, the average class size in Kansas is less than 20 students. Including special education staff assisting children with special needs, there are 1.5 teachers for every 20 students. Adding special education paraprofessionals and other classroom aides to assist these teachers, there are almost two instructional positions for every 20 students. Kansas had the 18th lowest pupil to teacher ratio among the 50 states in 2010, the year of the most recent national data.
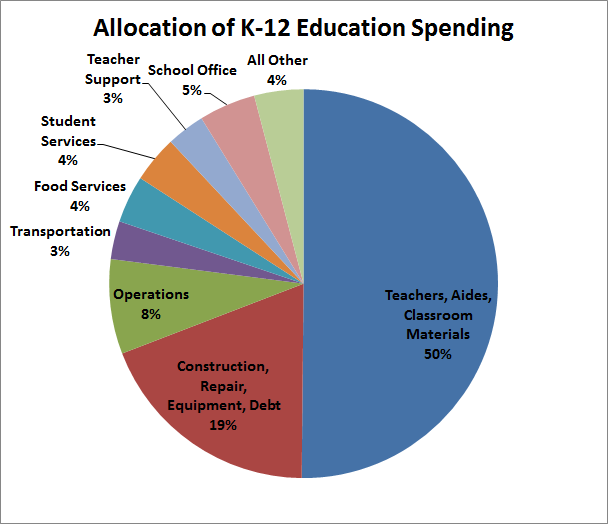
Salaries for teachers and classroom aides, along with textbooks and instructional supplies, make up just over half of that quarter-million dollars: about $125,000.
The next largest share of classroom costs is the classroom itself, along with the rest of the school building: the library, gym, auditorium and lunchroom, as well as equipment like computers to go with textbooks and chalkboards. On average, Kansas spends $50,000 for every 20 students for buildings and equipment, including payments on construction bonds. That brings the total to $175,000.
Once constructed, schools also must be maintained and operated. Kansas spends about $20,000 for every 20 students for heating, cooling, and cleaning school facilities, as well as keeping them safe and secure. That brings the running total of classroom costs to $195,000.
Next, students have to get to school. For every 20 students, Kansas spends $8,000 for transportation. State law requires transporting children who live more than 2.5 miles from school, and many more are bused for safety reasons.
Schools also provide meals for students. Lunch and breakfast programs cost about $10,000 for every 20 students, including fees paid by students and staff. These fees are also part of the total cost per pupil. Adding transportation and meals, the classroom total is now $213,000.
In addition to teachers, schools also provide counselors, social workers, psychologists, speech pathologists, audiologists, nurses, attendance and resource officers and security staff. Counting their support staff, Kansas schools have one of these student support positions for every six classrooms of 20 students, at a cost of $10,000 for a class of 20.
Schools also need libraries, technology support and programs to continuously improve teaching and learning. Kansas spends about $8,000 per classroom on these services, bringing the total to $231,000.
In charge of each school is a principal and his or her staff. These individuals supervise and evaluate teachers and other school support staff, oversee student discipline, and relations with parents and the rest of the school staff. In small schools, the principal is also responsible for many of the duties listed above. Kansas spends about $12,000 for every 20 students on school leadership - or about one principal or assistant for every 160 students. That brings the total to $243,000.
All other expenditures - about 4 percent of the total - are the remaining administrative costs, including the superintendent, business office, human resources and legal costs. In small districts, the superintendent is often also a principal and handles these duties and more. Most districts participate in cooperative organizations to share many of these functions and reduce costs.
According to the most recent national data, Kansas provides about $1,000 less per student from all sources than the national average, or $20,000 for a classroom of 20 students. Kansas spends less per pupil than neighboring states like Nebraska, Iowa, North Dakota and Minnesota.
However, Kansas ranks eighth in the nation across multiple achievement measures, including national reading and math tests, graduation rates, preparation for college and adult educational attainment. Among neighboring states, only Minnesota and Colorado have higher adult completion of high school, four-year college degrees and advanced or professional degrees.
Total school spending in Kansas in 2013 was 4.6 percent of total personal income in Kansas - compared to 4.9 percent 20 years ago. However, since 1990, the adult high school completion rate has increased from 81.3 percent to 89.5 percent, four-year degree completion from 21.1 percent to 29.8 percent, and advanced degree completion from 7.0 percent to 10.2 percent. Kansans are getting better results while actually spending a lower percentage of total taxpayer money.
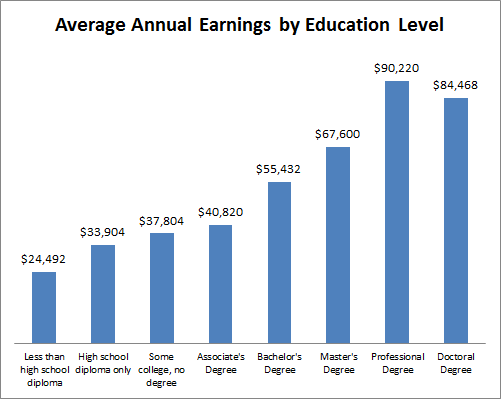
A quarter-million dollars is a big investment in a classroom of students. But the payoff is even bigger. The earnings difference between a high school graduate and a high school dropout is around $10,000 per year. If 90 percent (18) of those students graduate, that class will earn $180,000 more per year. If 30 percent (6) of those students receive a bachelor’s degree, they will earn another $20,000 per year, for a class total of $120,000 per year. If 10 percent (2) of those 20 students get an advanced degree, they will each earn at least another $10,000 per year.
That means a total additional earnings of $320,000 for a class of 20. If each individual works, on average, about 3.5 years for every year spent in K-12 schools, that class will earn at least $1,120,000 more over their lifetimes, or over a $1 million return on a quarter-million dollar classroom investment each year for K-12 education.
Notes and sources:
Total spending per pupil is from Kansas State Department of Education data.
Numbers of teachers and other staff are from KSDE reports. The Tallman Education Report blog post for Oct. 25, 2013, "Setting the Record Straight on School Employees and Spending," contains a table showing statewide district employees by budget categories for 2012-13.
The allocation $250,000 per classroom of 20 students is based on the most recent KSDE report of current operating expenditures by budget function, with percentages adjusted to reflect total expenditures. The difference between total expenditures and current operating expenditures is the amount used to determine capital expenditures for construction and equipment and debt service.
Data on state and national expenditures per pupil is from the U.S. Census Bureau for the most recent year available (2011).
Kansas’ ranking of eighth in the nation on multiple educational measures is based on KASB’s analysis of National Assessment of Educational Progress test results, graduation rates, ACT and SAT scores, and adult educational attainment.
For total school spending as a percentage of Kansas personal income, spending data comes from KSDE and income data from the Bureau of Economic Analysis.
Average annual earnings for levels of educational attainment is from the Bureau of Labor Statistics’ most recent report on median weekly earnings, multiplied by 52 weeks.
No comments:
Post a Comment
(Comments on this blog are moderated.)