
The following post is an effort to present in one place something I've never seen before: the total picture of school finance in Kansas over the past five years. School leaders complain about state funding cuts that constrain their budgets. Governor Brownback says his administration has increased state aid to K-12 education. Legislative leaders say they want to "count ALL the money" the state spends on education. The Kansas Policy Institute says Kansas school funding is at an all-time high. The media want to know who is telling the truth.
Everyone is.
This project, which I call "Counting All the Money," is an attempt to put in one place an accounting of all money received or spent by Kansas school districts, where the money comes from and what it can be used for, and how it has changed in recent years.
To do this, I've combined information from the Governor's Budget Division, the Kansas Legislative Research Department, and the Kansas State Department of Education. Although KSDE compiles a total spending report for the state and local school districts, it only break funding into three categories: state aid, federal aid and local revenue. It doesn't explain changes in the mix of how those revenues can be used.
To do this, I've combined information from the Governor's Budget Division, the Kansas Legislative Research Department, and the Kansas State Department of Education. Although KSDE compiles a total spending report for the state and local school districts, it only break funding into three categories: state aid, federal aid and local revenue. It doesn't explain changes in the mix of how those revenues can be used.
Likewise, the Legislature reports specific "line-time appropriations" for aid programs, but most document do not look at how those funds fit into total district budgets. Looking only at state aid does not explain changes in other parts of school budgets.
For this project, I focused on four years. First, 2009 was the "high water mark" school funding before the Great Recession. It was also the final year of funding increases approved by the Kansas Supreme Court to settle the Montoy school finance lawsuit. That level of funding was designed to provide constitutionally "suitable" school finance.
Second, 2011 was the first year of the Governor Brownback's administration. That allows a comparison between funding levels that the Governor inherited and what has changed under this watch.
Third, 2014 is the current school year, and 2015 is the upcoming year. The Legislature has already approved state aid for these two years, although the Governor has proposing adjustments the Legislature will consider. (In charts below, I refer to 2009 and 2011 as "actual" expenditures, because we know what was actually spent, and 2014 and 2015 as "approved" based on the Legislature's approved budget. However, I also include in total the Governor's new recommendations for both years, and estimates for other parts of the budget.)
To begin with, it may be helpful to think of Kansas school funding in terms of seven “building blocks.”
First, the state provides a “base” or foundation for general operating costs, using a base budget per pupil amount multiplied by weighted enrollment, and funded by a uniform statewide 20 mill property level and state aid.
Second, the state adds funding for a portion of special education costs.
Third, local school districts are allowed to enhance their operating budgets with a local option budget (LOB), financed mostly by local property taxes. However, LOB state aid is provided to over 80 percent of districts to help “equalize” property taxes.
Fourth, school districts receive federal funds for special education and other programs, and for school meals for low income students.
Fifth, the state provides aid to help make bond and interest payments for school construction projects in many districts. This aid has the same purpose as LOB state aid: to somewhat “equalize” the tax burden of constructing school buildings.
Sixth, the state pays the “employer’s contribution” toward the retirement benefits of school employees in the Kansas Public Employees Retirement System.
Finally, districts may raise local revenues for building and construction costs; and charge fees for meals, textbooks, activities and other local purposes allowed by state law . The total of these seven areas equals total school district expenditures.
I prepared a single spreadsheet that contains all of the following information, but I have broken it down to explain the details of each budget "block." The first chart shows the dollar amount for FY 2009, FY 2011, FY 2014 and FY 2015. The second charts shows the dollar and percent CHANGE from 2009 and 2011 to 2015. In addition, I've color-coded the charts as follows: yellow = the Governor's proposed changes for the current year and next year, blue = a school district budget amount, light pink = state aid appropriations from the state general fund, which is the main "discretionary" budget for the state, and dark pink = state aid from other revenue sources.
Each item explained below has a number in parentheses that matches a funding line in the chart that follows.
Each item explained below has a number in parentheses that matches a funding line in the chart that follows.
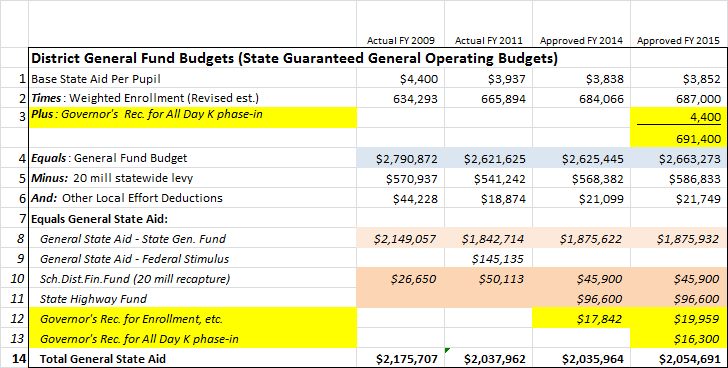
District General Fund Budgets
School finance starts with a base budget per pupil (1), which is multiplied by the total weighted enrollment (2). (Weightings are factors in the school finance formula that provide extra funding based on issues that have been been determined to add costs: low income and at-risk students, bilingual and vocation education, transportation and district size, among others.)
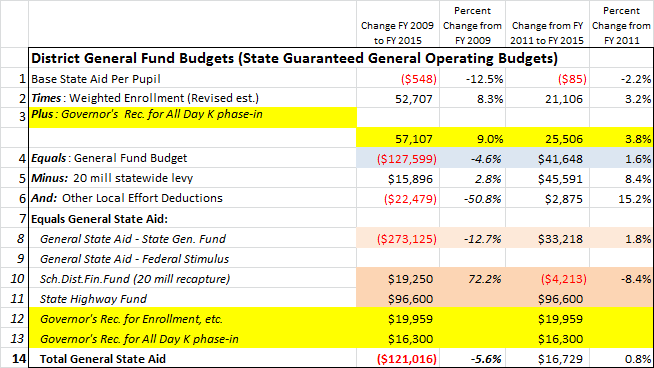
The highest base budget per pupil was $4,400 in FY 2009, which was reduced to $3,937 in 2011. After dropping to $3,780 in 2012, it was increased to $3,838 last year and this year. The base is supposed to increase to $3,852 next year, which would still be 12.5 percent lower than 2009.
Note that weighted enrollment statewide has increased significantly. While actual “full time equivalent” students have increased by less than 3 percent since 2009, weighted enrollment has increased by over 8 percent. This includes, for example, at-risk weighting based on the number of students qualifying for free meals due to lower family incomes. Total weighted enrollment has increased by over 52,000 students since 2009. (Less than half of that increase has occurred since 2011.) This means that over half of the base increase is not because districts are receiving less money: it is because they didn’t get additional money for the additional weighted students.
Beginning to fund all-day kindergarten, as the Governor proposed, would add another 4,400 weighted students (3). The increase in weighted students since 2009 has been more than the total enrollment of the largest district in the state (Wichita).
Multiplying the base by weighted enrollment equals the district’s general fund budget entitlement (4). The general fund budget is the state’s guaranteed amount to fund basic educational programs. Note that the reduction in the base per pupil is a larger percentage than the decrease in the general fund budgets (in blue). That is because although the base is lower, districts can count many more weighted students. However, that has not made up for the cut in general fund budgets since 2009. Even after a base increase last year and scheduled increase next year, statewide general fund budgets remain over $127 million below 2009, or 4.6 percent. However, if the Governor’s recommendations are adopted, general fund budgets will be $42 million higher than the Governor’s first budget in 2011.
This explains how a school district's general fund budget is determined. But how is it financed?
The general fund is financed first by the 20 mill statewide property tax levy (5), and certain other “local effort” deductions, such as federal impact aid (6). Both are subtracted from the general fund budget amount to produce the district’s general state aid entitlement (7). General state aid is currently funded from three sources: appropriations from the state general fund (8), the school district finance fund, from revenues paid to the state if the 20 mill levy in a district raises more than the district’s general fund entitlement (10), and transfers from the state highway fund (11), which were used to pay for school district transportation weighting in FY 2014 and 2015.
Note that in FY 2011, the state used federal stimulus funds to provide $145 million in general state aid. (9) Since 2009, state general fund support of general state aid has been reduced by $273 million. This has been offset in part by an increase in the state district finance fund “recapture” from the 20 mills, and the $96 million highway fund dollars for both years. However, state funding has not replace most of the federal stimulus funding that expired. This is why the Governor notes that state funding has increased significantly since 2011, but district general fund budgets are still below were they were in 2009.
Note that in FY 2011, the state used federal stimulus funds to provide $145 million in general state aid. (9) Since 2009, state general fund support of general state aid has been reduced by $273 million. This has been offset in part by an increase in the state district finance fund “recapture” from the 20 mills, and the $96 million highway fund dollars for both years. However, state funding has not replace most of the federal stimulus funding that expired. This is why the Governor notes that state funding has increased significantly since 2011, but district general fund budgets are still below were they were in 2009.
Under the formula, if enrollments are higher than expected, or if the statewide levy raises less than expected, the base per pupil is reduced to “fit” the money available. Both are projected to occur this year and next. To avoid a cut in the base, the Governor recommends adding $17.8 million this year and $20 million next year (12). In addition, the Governor recommends phasing in payment of all-day kindergarten programs beginning next year, which would add 4,400 weighted students, at a cost of $16.3 million (13). If these funds are added, total general state aid would be still down $121 million, or 5.6 percent, compared to 2009, but $16.8 million higher than 2011 (14).
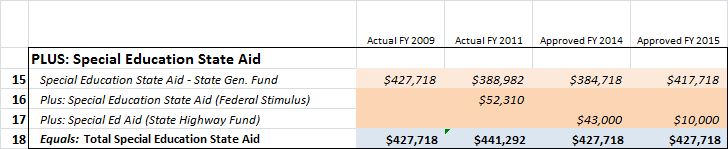
Special Education State Aid
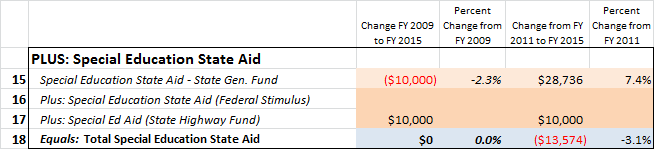
In addition to general state aid for their general fund budgets, under state law districts are supposed to receive special education state aid to pay 92 percent of the “excess” of serving special needs students. However, current funding is only about 80 percent of this formula. Special education aid is currently financed by two sources: state general fund appropriations (15) and state highway fund transfers to cover special education transportation costs (17). (In 2011, federal stimulus funds paid for $52 million of special education costs. [16])
Total special education aid (18) is unchanged since 2009, which is required by federal “maintenance of effort” requirements.
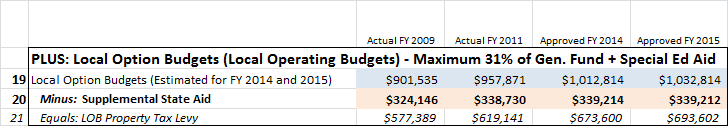
Local Option Budgets
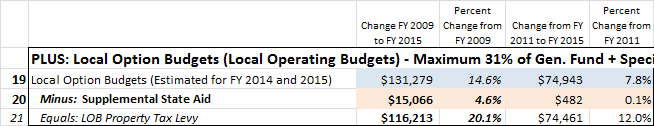
Districts are allowed to adopt a local option budget of up to 31 percent of their general fund budget plus special education state aid. This total increased from about $900 million in 2009 to over $1 billion (19). (Under current law, districts calculate the general fund as if the base was $4,433, the budgeted level in 2009, rather than the actual amount, in order to avoid reducing the LOB as the base was cut.) Total LOB use in 2015 is projected to be $131.3 million higher than in 2009, which would offset the overall reduction in general fund budgets (4). However, many districts could not do so because they reached the LOB maximum.
The LOB is financed by two sources: state aid and local property taxes. LOB state aid, called supplemental general state aid (20) is provided to districts based on their taxable property wealth per pupil (the highest-wealth districts do not receive any aid). Whatever portion of the LOB is not funded by state aid must be raised by a local property tax (21).
Because LOB state aid has been increased by only $15 million since 2009, property taxes have paid for most of the increase in the LOB: $116 million or a 20.1 percent increase. LOB state aid is about $100 million short of the formula amount. Increasing LOB state aid in most districts would reduce local property taxes, not increase district budgets (unless the maximum was raised).
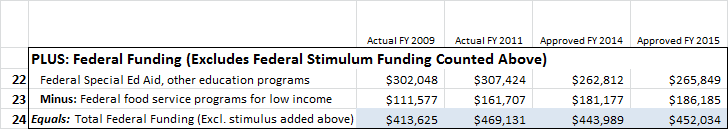
Federal Funding
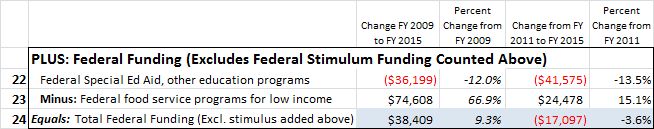
School districts also received federal funding. (The chart below does not include federal stimulus funding for 2011, because those dollars were included above in general state aid and special education aid.) The portion of federal funding actually used for classroom instruction and student and teacher support programs, such federal special education aid and "Title I," has declined by $36 million (22). However, federal aid for lunch and breakfast support for low income students which has increased by almost 70 percent (23). Total federal funding has increased 9.3 percent since 2009, but has declined by 3.6 percent since 2011 (24).
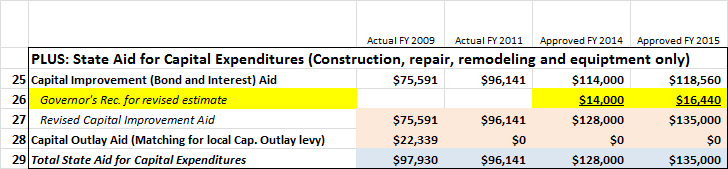
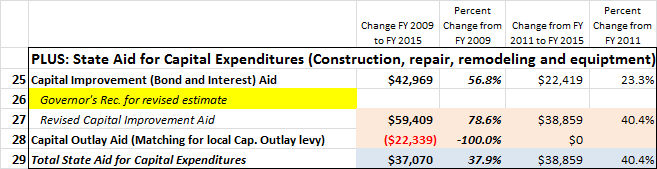
State Aid for Capital Expenditures
In addition to the LOB, districts that have issued bonds for building construction or remodeling may qualify for state capital improvement aid based on their property wealth (25). This program has increased substantially since 2009, and the Governor is recommending that $14 million be added this year and $16.4 million next year to pay for higher than expected costs (26). If approved, capital improvement funding will have increased $59.4 million, or 78.6 percent, since 2009 (27). However, none of this money can be used for regular operating expenditures - essentially, it is used to reduce property taxes in lower wealth districts.
Although the state has increased funding to help pay for construction bonds since 2009, it has stopped providing any funding for another program, capital outlay state aid, which matched local property tax levies for construction and equipment financed without debt. Eliminating that program reduced state expenditures by over $22 million (28). The net funding for both programs has increased about
40 percent since both 2009 and 2011 (29).
40 percent since both 2009 and 2011 (29).
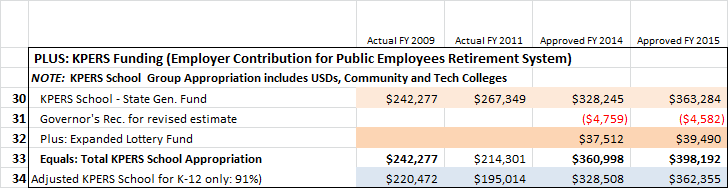
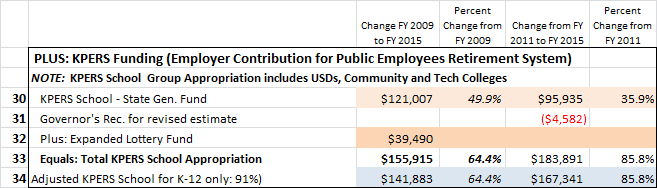
KPERS Funding
The final major state aid program is contributions for school employees under the Kansas Public Employees Retirement System. The state appropriations to the “school group” covers employees of community colleges and technical colleges, as well as K-12 school districts (30). The state contribution is a percentage of employee salaries. The Governor is recommending reductions in this appropriation in the current year and next year, based on new estimates of lower than expected salaries (31). In addition to state general fund appropriations, the Legislature approved using revenues from the expanded state lottery fund to help pay for KPERS in FY 2014 and 2015 (32).
Total state aid for KPERS schools has increased significantly - $156 million or 78.6 percent - as the Legislature seeks to reduce the unfunded liability in the system (33). To add this amount to total school district spending for this analysis, we assign 91 percent of the total amount to school districts, excluding payment for college employees (34). These funds simply “pass through” the district budget. They cannot be used for regular operating costs.
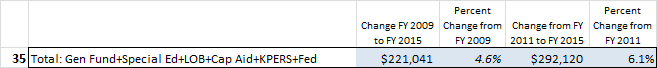
The total of these budgeted state and federal revenues has increased by $221 million since 2009. However, this increase has been entirely funded in three areas: higher capital improvement aid for school bonds; higher KPERS contributions; and increased federal funding for student meals (35).

All Other Local Spending and Total Spending
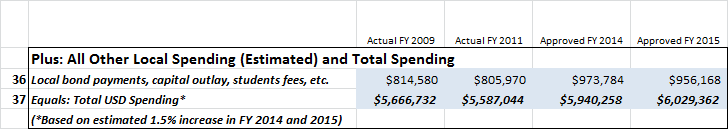
The part of school budgets listed above can be estimated fairly accurately because of enrollment projections and state appropriations. However, it is more difficult to estimate total school spending for the current year and next year. Total spending includes local decisions about bond payments, capital outlay spending and fee-funded revenues for meals, textbooks and activities (36). These expenditures may not be finalized and are not reported until the end of the year.
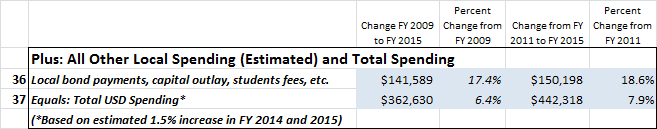
For this analysis, we estimated that total school budgets will increase by about 1.5 percent in both 2014 and 2015 (37), the same rate as 2013. If that occurs, it would mean total spending would have increased by $362.6 million over 2009, or about 6.4 percent, and all other local spending would have increased by $141.6 million. Most of this "other" spending is for debt payments, capital costs, or fees for meals or other restricted purposes. Almost all of these revenues are from local property taxes or fees charged to students and their families. Almost none of these can be used for regular educational costs.
Key Trends in School Funding: State Aid
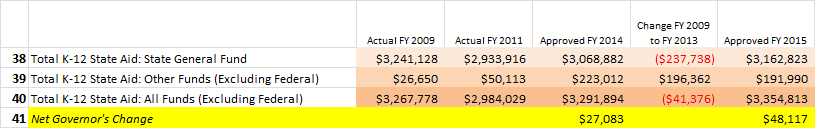
Under the Governor’s budget, total K-12 state aid to school districts from the state general fund would be $3.16 billion in 2015, down $78 million from 2009 (38). However, state aid from other funds - mainly the state highway fund - has increased $165.3 million (39).
Under the Governor’s budget, total state aid from all funds (excluding federal stimulus funding) in 2015 would have increased $87 million since 2009, and $370.8 million since his first budget in 2011 (40). Where have those increases been directed?
Since 2011, over half of that increase has been KPERS aid (up $167.3 million) and capital Improvement aid (up $39 million) - which cannot be used for regular operations. For school district general fund, or operating budgets, General state aid from the state general fund already appropriated is up $33 million and the state highway fund $96.6 million, and the Governor’s new budget proposal would add $20 million for increased enrollment and $16.3 million for the first year of all-day kindergarten. However, this increase of $165.9 million is offset by the loss of $145 million in federal stimulus funding in 2011. That is why school operating budgets are still down, even though total state aid is up.
The net cost of the Governor’s recommendations this Legislative session is $27 million more in FY 2014 and $48 million more in FY 2015 (41).
Trends in School Funding: State and Local Balance
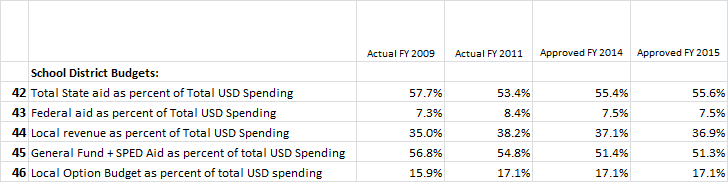
Next, let’s look at some other trends in school funding. Total aid from the state has dropped from
57.7 percent to 55.6 percent of total school spending (42), while federal aid has risen just slightly (43) and local revenues increased from 35.0 percent to 36.9 percent (44). It’s worth noting that Kansas has long ranked high among states in terms of the percentage of budget from state funding. This was done to reduce reliance on property tax, and to equalize differences in tax rates resulting from differences in local property valuation. Kansas seems to becoming more like the rest of the country, with more reliance on local revenues for school funding - at a cost of higher local property taxes, especially in lower-wealth school districts.
57.7 percent to 55.6 percent of total school spending (42), while federal aid has risen just slightly (43) and local revenues increased from 35.0 percent to 36.9 percent (44). It’s worth noting that Kansas has long ranked high among states in terms of the percentage of budget from state funding. This was done to reduce reliance on property tax, and to equalize differences in tax rates resulting from differences in local property valuation. Kansas seems to becoming more like the rest of the country, with more reliance on local revenues for school funding - at a cost of higher local property taxes, especially in lower-wealth school districts.
The share of total spending funded directly by the state for annual operating budgets - the general fund and special education aid - dropped from 56.8 percent in 2009 to 51.3 percent in 2015 (47), while the LOB increased from 15.9 percent to 17.1 percent (48). Local property taxes have increased to make up for reductions in state operating funds.
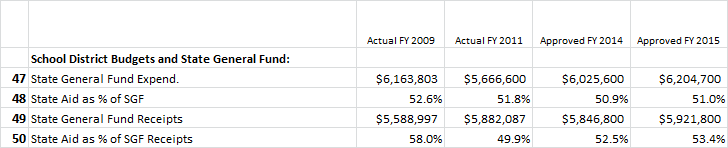
K-12 State Aid and the State General Fund
Under the Governor’s budget, total state general fund expenditures for all state programs in FY 2015 would be just slightly above the 2009 level by $40.9 million or 0.7 percent (47). Since total state aid from the state general fund has declined by $78.3 million (38), the share of the state general fund going to education has declined from 52.6 percent to 51.0 percent (48). In 2009, as well as in 2014 and 2015, the state was spending more from the state general fund than was coming in through revenues (49), and state aid dropped from 58 percent of state general fund receipts in 2009 to 53.4 percent in 2015 (50).
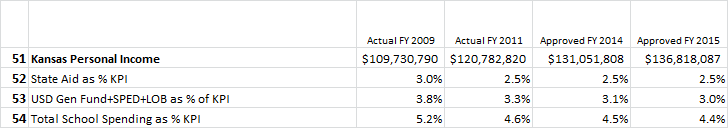
Based on projections adopted by the state Consensus Revenue Estimating Group, Kansas personal income - the total of all income from all sources received by Kansans - is expected to reach $136.8 billion in 2015, almost 25 percent higher than in 2009 (51). State aid for K-12 education has declined from 3.0 percent of Kansas personal income in 2009 to an estimated 2.5 percent in 2015 (52). School operating budgets, including the general fund, special education state aid and local option budgets, have declined from 3.8 percent to an estimated 3.0 percent (53). Total district spending dropped from 5.2 percent to 4.4 percent (54). By every measure, Kansans are spending a smaller percentage of total income on K-12 education.
Inflation Rate
Since 2009, the consumer price index (CPI), or inflation rate, increased just over 13 percent, or slightly more than half the increase in personal income (55). The CPI has increased nearly 8 percent since 2011. To adjust any of the amounts in these charts for inflation, add 13.1 percent to 2009 figures and 7.9 percent to 2011 figures to compare to 2015. (The inflation rate through 2015 is based on the November 2013 Kansas consensus revenue estimate.)

Funding Per Pupil
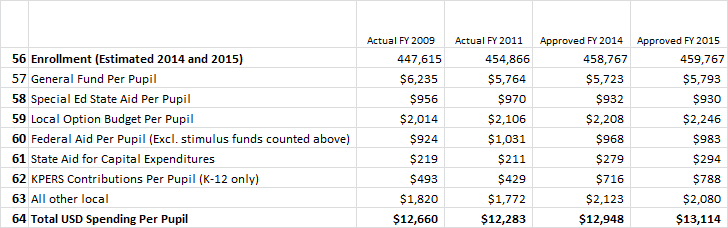
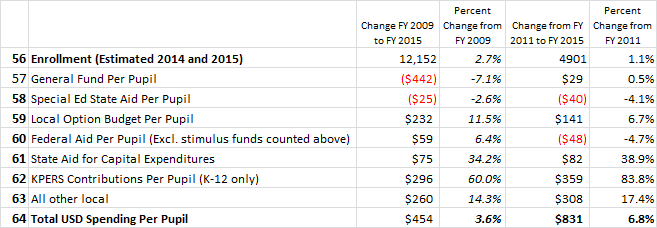
As noted above, student enrollment has increased 2.7 percent since 2009 and 1.1 percent since 2011 (56). Converting total spending amounts to actual per pupil (not weighted) amounts, general fund spending has declined by $442 or 7.1 percent compared to 2009 (57). Special education state aid per pupil is down 2.6 percent since 2009 and 4.1 percent since 2011 (58). Increased local option budgets have offset about half the general fund per pupil reduction since 2009 (59). Federal aid has increased since 2009, but has dropped since 2011 (60).
The only areas of districts that have increased more than inflation on a per pupil basis are state aid for capital expenditures (61), KPERS contributions (62) and other local expenditures (63).
Total spending per pupil has increased 3.6 percent since 2009, and 6.8 percent since 2011 (64). This means total spending per pupil is 9.5 percent less than the rate of inflation since 2009 and about 1 percent less than inflation since 2011.
No comments:
Post a Comment
(Comments on this blog are moderated.)