Wednesday, May 3, 2017

After decades of increasing funding to support educational improvement, Kansas policy has changed. So has performance

This post is from a report on school finance released by KASB as the Kansas Legislature works to develop a new school finance plan in compliance with the Kansas Supreme Court decision on adequate funding. Today: since 2009, school funding in Kansas has not kept up with inflation; improvement in some educational indicators has reversed, especially for some groups; and these groups are not evenly distributed across the state.


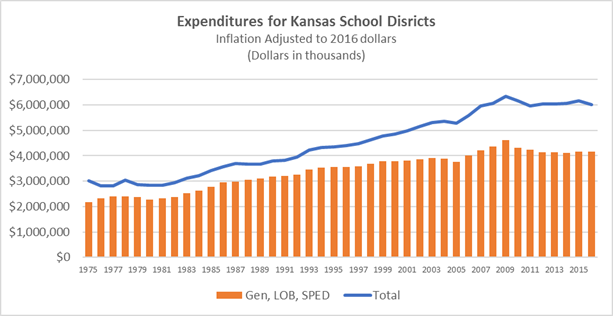
For nearly 35 years, Kansas consistently increased school funding more than inflation, which funded improvement resulting in higher educational levels. Since 2009, that has reversed.


A. Overall Kansas school funding has fallen behind inflation since 2009, and state and local operating funding has fallen even further behind.


Although overall dollars are higher, when adjusted for inflation, total Kansas school funding is lower than 2009 and at the same level as 2007, and general operating budgets (general funding, local option budgets and special education state aid) is at 2006 levels – meaning no “real” (above inflation) increase in approximately ten years.


This ten-year effective funding freeze has occurred when enrollments have increased, especially for special needs students, and expectations for student achievement have risen.

B. Kansas funding has fallen behind other states, especially the highest achieving states.


Between 2008 and 2014, Kansas per pupil funding increased just 1.7 percent, less than one third of the national average of 6.2 percent. Thirty-seven states increased per funding more than Kansas.
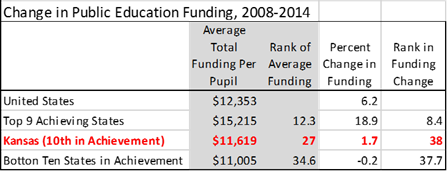

Over that period, the highest achieving states increased per pupil funding by 18.9 percent, while the lowest achieving 10 states cut funding by 0.3 percent.


C. State and national tests of basic skills, which are “early indicators” of student success, show signs of decline or stagnation, especially for students with special needs.


The State of Kansas argued in the Gannon case that the high and rising level of educational attainment in Kansas was evidence of funding as constitutionally suitable and adequate. The Supreme Court rejected that view for three reasons.


1. Recent educational indicators suggest that educational improvement is slowing and perhaps reversing.


The Supreme Court relied heavily on two types of assessments: state tests given to almost all Kansas students, but which were significantly changed in between 2013 and 2015, and the National Assessments of Educational Progress, which is given to small sample of students in Kansas and all other states.


State assessments


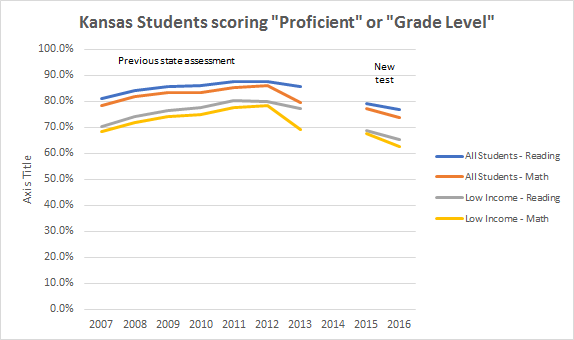
On the Kansas assessments since 2007, the percent of students scoring at the “proficient” level under the No Child Left Behind act rose steadily for all students and low income students until 2012.


However, performance levels dropped noticeably  in 2013, the last year of the previous round of assessments. A new testing system was to begin in 2014, but because of technical issues no results were provided. Results for the new test, which used a benchmark called “grade level” comparable to the previous “proficient” began in 2015 and scores further declined in 2016.

National assessments


Kansas, like all other states since 2003, participates in the National Assessment of Educational Progress (NAEP), which tests a sample of students in reading and math at fourth and eighth grade in odd-numbered years. The “basic” level of NEAP is comparable the “grade level” benchmark on the new state assessments.


Beginning in the early 2000’s, Kansas NAEP performance increased through 2007, remained fairly level through 2011, and declined in 2013 and 2015. (Although NAEP allows comparison with other states and provides a longer timeframe than state assessments, which tend to change every few years, it has the limitation of being a much smaller sample size and only two grade levels.)


National Assessment of Education Progress: Percent of All KS Students At Basic or Above

2000/02
2003
2005
2007
2009
2011
2013
2015
Fourth Grade Math
76
85
88
89
89
90
89
83
Eighth Grade Math
76
76
77
81
79
80
79
76
Fourth Grade Reading
68
66
66
72
72
71
71
68
Eighth Grade Reading
81
77
78
81
80
79
78
79
Average
75.25
76
77.25
80.75
80
80
79.25
76.5


Other indicators
Although state and national standardized tests have shown a decline in recent years, other indicators are more mixed. As noted above, educational attainment by young adults has continued to improve. The state’s “on time” graduation rate has also improved, and the percentage of students scoring “college ready” in all subjects on the ACT exam for prospective college students has increased.  The concern is that declining performance at lower grades measured by state tests and the NAEP will begin to impact performance of older students as they prepare for graduation and college.


2. Too many Kansas students are not meeting expected educational outcomes, especially among certain groups.


The Supreme Court included the following table in the recent Gannon decision.
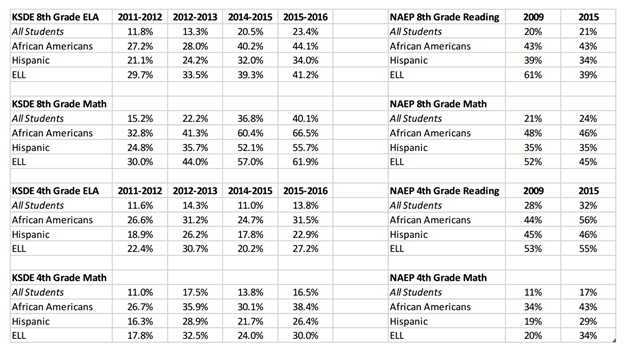

The chart shows the percentage of students NOT scoring at the “proficient” or “grade level” benchmarks on state assessments and the percent of students NOT scoring at basic on the NAEP in the overlapping grades and subjects. Note these percentages in the most recent years range from around 17 to 24 percent for ALL students, but are significantly higher for African Americans, Hispanics and English Language Learners.


These “achievement gaps” are consistent with other KASB reports showing that low income students, students with disabilities and other groups have lower graduation rates and NAEP scores.


3. These students are not randomly distributed across schools and districts; they are disproportionately students with circumstances that affect their success in school.


Most students who lag behind their peer and are “at risk” of failing to graduate are affected by circumstances outside of the school’s direct control, such as poverty, disability, illness, family issues, etc. (It is hard to do homework if you are homeless.) These factors are not evenly distributed.

There is no evidence Kansas could achieve higher student success through expanded school choice.

This post is from a report on school finance released by KASB as the Kansas Legislature works to develop a new school finance plan in compliance with the Kansas Supreme Court decision on adequate funding. Today: states with tax credit programs to provide scholarships to private schools have no better academic success than Kansas, and in most cases, worse.

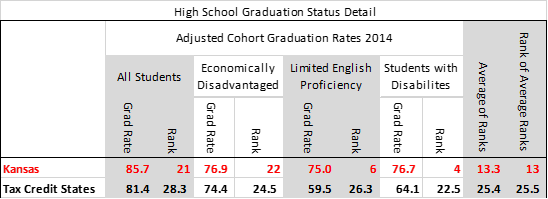
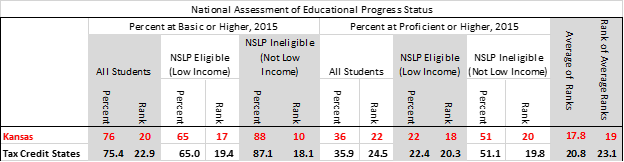
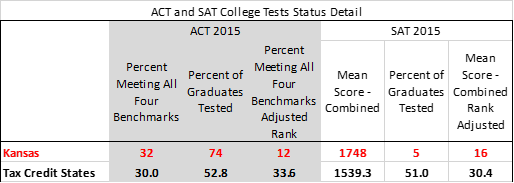
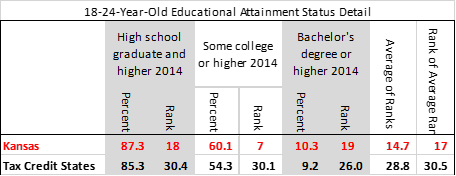
Using data from the Cato Institute and the Friedman Foundation, KASB identified eight states that have had tax credit programs similar to the Kansas program since at least 2008, to give some time for the programs to have an impact that could be measured on national reports. The following charts compare Kansas outcomes on the 15 indicators used in KASB’s state education report card with the average performance of these states.


In almost every case, Kansas performs equal to or higher than states with established tax credits. These states spent, on average, $300 more per pupil than Kansas in FY 2014, equal to nearly $150 million. The few states that rank above Kansas on multiple, but not all, measures (Indiana and Iowa) ranked higher in spending per pupil, as well.

Tuesday, November 22, 2016

New Revenue Estimates Part 3: Declining investment in School Funding


The latest official consensus revenue estimates for the Kansas state general fund were released Nov. 10. Much of the attention has focused on a $345 million drop in expected revenues in the current year, as well projections for significant budget deficits in the next two years. KASB takes a more detailed look at how the new projections compare to longer term economic and budget trends in Kansas, and what it means for education funding.

The first part shows how Kansas personal income has consistently fallen below projections and trails the national average. The second part shows how state tax revenues have not kept up with income growth since the major income tax cuts of 2012 have decreased revenue to the state, resulting a lower percent of economic growth invested in education and public services. The third part shows how the failure of the Kansas economy to recover from the Great Recession and the failure of the tax cuts to stimulate the economy have squeezed state spending, including education.

Part 3: Slow economic growth and tax policies have an impact on school funding.


Slow income growth and lower tax revenue growth almost inevitably mean less growth in school finance, which relies on state aid for two-thirds of its funding. (Kansas is higher than most states in this regard. The trade-off for a higher share of state funding is that it allows lower property taxes and less funding disparity due to major differences in local tax resources.)

Using the best records available, total school district funding in Kansas has averaged a 5.6 percent increase per year since 1975, or 1.8 percent after adjusting for inflation. When considering general operating funding (general fund budgets, special education state aid and local option budgets) the average annual increase since 1975 has been 5.3 percent, or 1.6 percent after inflation, slightly below total funding.

Since 2008, however, total funding has increased an average of 1.3 percent, and after adjusting for inflation, actually declined an average of less than 0.1 percent per year. However, since 2008 most of the growth in school funding has been in areas set by local voters, such as bond issues, or higher contribution rates for the Kansas Public Employees Retirement System.

These expenditures are not part of general operations. As a result, general operating expenditures (defined as school district general fund, local option budget and special education state aid) increased an average of just 0.71 percent per year since 2008, and actually declined an average of 0.7 percent per year after inflation. This is why school boards, staff, parents and communities see “cuts” in personnel and programs even though total funding may be higher - because dollars available for general operations have lagged behind inflation.

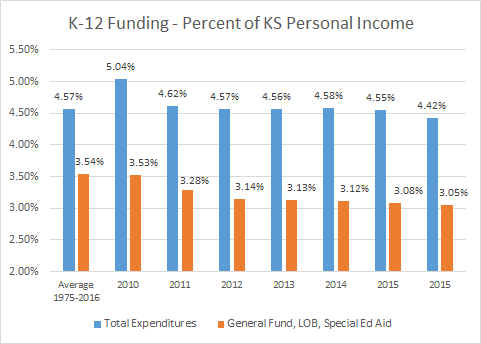
As a result, school funding has been declining as a percent of personal income. Total K-12 funding has averaged 4.6 percent of Kansas personal income since 1975 and topped at 5.0 percent in 2009 and 2010, but is estimated to be 4.4 percent in 2016 - the lowest level in 30 years. General operating funds averaged 3.5 percent of personal income but are estimated to be less than 3.1 percent in 2016 - the lowest level recorded.

In other words, Kansans are providing the lowest share of income to K-12 in decades for this generation of students, even as school district expectations for student performance have continued to increase.

Kansas funding has also fallen behind the nation. Kansas total revenue per pupil was 97.5 percent of the U.S. average in 2009 but declined to 93.7 percent in 2013, the most recent year available. It is likely Kansas has fallen further behind since then because the U.S. economy has been growing faster than Kansas, but official data on state school funding lags several years behind.

The most immediate issue for the Governor and Legislature is the reduction of $346 million in anticipated revenues for the current year (FIscal 2017). Because the Legislature built a budget with a very small ending balance - and because actual tax revenues for 2016 were over $100 million less than expected - the Legislature will have to make almost $350 million in “adjustments” to avoid a deficit in the state general fund.

That equals over 5.5 percent of approved expenditures in a budget year that will be more than half over when the Legislature returns in January. Adjustments could mean spending cuts, payment delays, or new revenues (raising taxes).

One part of the problem is that the Governor delayed an additional $75 million in state aid due to be paid to schools in at the end of June. That delay saved the state $75 million and helped avoid a deficit, but adds $75 million in FY 2017. An option likely under serious consideration is to make a similar delay - or even larger - from June 2017 to July of 2018.

Such a delay could be even larger because the 20 mill statewide levy and mineral production fund will raise less than expected in current year FY 17. There is no revenue to make this up in the state general fund profile, which would make the deficit even larger if included. That could be added to the delay (pushing into next year), or school district funding could be reduced.

If a similar delay in state school aid was made again (and perhaps increased to $100 million), the Governor and Legislature will still face a projected $250 million gap, equal to over 4.0 percent. Even if the Legislature (and Governor) agreed to increase taxes at some level, it is extremely difficult to do so in time to raise much revenue for 2017.

The situation in 2018 and 2019, the upcoming two-year budget the Governor will propose and the Legislature will adopt, is less clear. Legislative Research Department budget profiles show budget gaps of $582.6 million in 2018 and $172.3 million in 2019. However, those numbers assume the Legislature returns to “current law” on transfers into and out of the state general fund. That means the Legislature would stop transferring money from the state highway fund and early children revenues; and start sending money to programs that have not been funded for years.

Even if the Legislature continues current transfers (which has been extremely controversial), tax revenues are expected to grow just 1.4 percent in 2017 and 2.4 percent in 2018. If school district state aid grew at the same rate, the current roughly $4 billion in state aid would increase by $56 million in 2018 and $97 million in 2019. The KPERS contribution for school districts is scheduled to increase $78.6 million in 2018 and $45.5 million in 2019. In additional, bond and interest state aid is expected to increase enough to use up any new revenues at those rates.

In other words, any increase in school district operating budgets would require continuing current transfers AND either increasing school spending more than other programs or raising taxes - unless state revenues begin growing much more rapidly. (Not addressed is how or when the state would be repay approximately $100 million in KPERS payments that were not paid last year.)

To put this all in perspective: if you, your children or grandchildren attended Kansas public schools between 1975 and 2008, Kansas taxpayers spent on average of 4.6 percent of total income on K-12 education, and increased spending an average of 1.8 percent more than inflation every year, allowing school districts to hire more teachers and support staff, offer more programs and services and keep salaries and benefits competitive.

However, since 2009 - the entire time that current eighth graders have been schools - the share of income going to K-12 education has been declining, and annual funding increases have averaged less than the rate of inflation. While education funding in most states has recovered since the Great Recession, Kansas lagged behind. Over this same period, indicators of student success - test scores, graduation rates, preparation for and participation in postsecondary education - have slipped for Kansas students.

The 2017 Legislature will have to decide whether to allow these trends to continue, or take steps to change course.

New Revenue Estimates Part 2: Tax revenue lagging behind income

The latest official consensus revenue estimates for the Kansas state general fund were released Nov. 10. Much of the attention has focused on a $345 million drop in expected revenues in the current year, as well projections for significant budget deficits in the next two years. KASB takes a more detailed look at how the new projections compare to longer term economic and budget trends in Kansas, and what it means for education funding.

The first part shows how Kansas personal income has consistently fallen below projections and trails the national average. The second part shows how state tax revenues have not kept up with income growth since the major income tax cuts of 2012 have decreased revenue to the state, resulting a lower percent of economic growth invested in education and public services. The third part shows how the failure of the Kansas economy to recover from the Great Recession and the failure of the tax cuts to stimulate the economy have squeezed state spending, including education.

Part 2: State tax revenue has not kept up with state personal income growth.

Part 1 of this post discussed how the Kansas economy, measured by Kansas personal income, has grown much more slowly since the Great Recession of 2008 than it has over the past 20 years, and has also lagged behind the rest of the United States. With income growth lagging, what has happened to state tax revenue?


Kansans pay two major state taxes: income taxes (both individual and corporate) and sales taxes. Most - but not all - of the revenue from these taxes goes into the state general fund (SGF). Almost all of the SGF comes from these two sources, with some additional revenue from cigarette, liquor, severance (oil and gas) taxes and insurance premiums making up about 5 percent.

The state general fund is typically about half of the state “all funds” budget. The all funds budget contains all other state revenues, most significantly, federal aid. Except for the general fund, the all funds budget revenues must be spent on specific purposes. These include all federal funds, revenues from gas taxes for highway construction, state university tuition and other income. In other words, the all funds budget includes not only taxes but fees and other revenues.

(Kansas lottery money does not go into the state general fund. It goes into something called the Economic Development Initiatives Fund and mostly spent for programs in the Department of Commerce and a few higher education and tourism programs. It does not support K-12 education and never has.)

The state general fund receives and spends general state taxes; the state all funds budget receives and spends restricted state taxes and fees and federal aid. Not included in either are local taxes raised and spent by cities, counties and, of course, school districts.

During the 1970’s, 1980’s and 1990’s, the state of Kansas took over more responsibility for many government functions, whether to provide more uniform and coordinated services, to reduce local property taxes, or both.

A good example was school finance. From mid-1970’s to the early 1990’s the School District Equalization Act used state aid to assist lower wealth districts and reduce tax rates, although the majority of school funding come from local property taxes. The 1992 school finance raised state income and sales taxes in order to increase education funding but also reduced local tax levies. For the first time, the state provided a majority a school funding.

(A more recent change concerns the 20 mill statewide school levy, which used to remain with local school districts. Starting in 2015, the 20 mill levy has been sent to the state, deposited in the “School District Finance Fund” - part of the all funds budget but not the state general fund - and then sent back to school districts as general state aid.)

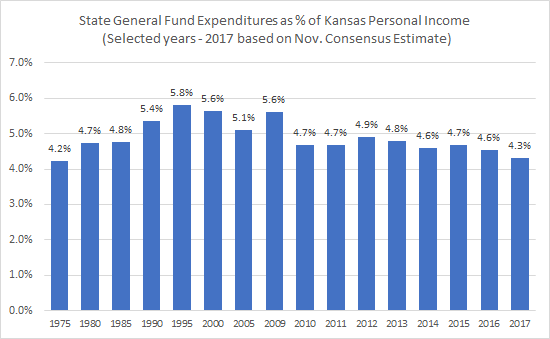
Between 1975 and 1995, when the 1992 school finance law was fully implemented, state general fund expenditures, which are mostly financed by state sales and income taxes, grew from 4.2 percent to 5.8 percent of Kansas personal income. The all funds budget, which includes the state general fund, increased proportionately, from 9.3 percent in 1973, to 12.7 percent in 1995.

Between 1994 and 2012, state general fund spending averaged 5.3 percent of Kansas personal income, and all funds spending averaged 11.9 percent.

The growth in the state general and all funds budgets did not entirely results in a higher overall tax burden (compared to personal income). A report from the Tax Foundation shows that Kansas state and local tax budget as a percent of state personal income - which would include local taxes but not state federal aid and fees such as student tuition-  was 9.7 percent of personal income in 1977, 10.3 percent in 1995, and 9.5 percent in 2012 (the last year available).

In summary, state spending as a share of personal income has changed relatively little in the past 40 years, and much of the increase has been offset by lower local spending in education and other areas.

However, this relative stability began to change in 2012 when major state income tax cuts were passed. State general fund expenditures were 4.9 percent of personal income. Despite several major increases in sales and other excise taxes since then, state general expenditures have dropped to an estimated 4.5 percent of personal income in 2016.

The Legislatively  approved state general fund expenditures for the current year, 2017, would drop to 4.4 percent of personal income. But if the state has to cut spending by $349.1 million to avoid a deficit, as indicated by the Legislative Research Department, expenditures would drop to 4.3 percent of personal income - the lowest level since 1976.

All funds spending has also declined, from 11.8 percent in 2012 to an estimated 11.1 percent in 2017 - and the all funds spending is inflated by over $600 million from the statewide mill levy added in 2015.

These trends are expected to continue. The new CRE expects Kansas personal income to grow at 3.9 percent in both 2017 and 2018, but projects state general fund tax revenue to grow at just 1.4 percent in 2018 and 2.2 percent in 2019. In addition, the CRE expects inflation to increase by almost 2.0 percent each of the next two years, which means state tax revenue growth won’t keep up with inflation.

In  other words, not only is Kansas personal income growing at historically low rates, the current tax structure is generating a shrinking percentage of that income for state programs, such as education.

Why does this matter? It may sound good for the taxpayer to return state spending as a share of income to 1970’s levels. But are citizens willing to accept a 1970’s level of government services?

Consider some of the changes in education alone. Special education services really began in the 1970’s and costs have accelerated for children with high cost medical needs and autism. Preschool and all kindergarten have expanded to meet educational needs and parental demands. Graduation rates have increased and schools are expected to prepare far more students for college and technical programs as the share of jobs requiring advanced skills has doubled - which also has expanded the need for technical and community college and university programs.

Education at all levels is the state’s biggest expenditure, but social services are second. The cost of medical and related services today is far greater than in the 1970’s. Demands for public safety have expanded the pressure for correctional programs. Roads and infrastructure requirements have also increased.

An obvious reason for declining state revenues was the major reductions in income tax rates. However, Gov. Sam Brownback and some others have proposed shifting more of the tax burden to “consumption” taxes, which in Kansas is mainly the sales tax. But a growing share of sales transactions are exempt from tax, such as services, healthcare, and Internet sales. As a state expert explained when the November CRE was presented, people are spending more on things that are NOT taxed, and less on things that ARE taxed. As a result, the sales tax isn’t keeping up with economic growth.

Therefore, if it seems school funding and other public services are stretched more than ever and funding is not keeping up with costs and demands, it’s because it is true. Kansas has been experiencing historically low growth in its economy. At the same time, the state tax structure is providing a shrinking share of that growth for public services. For the next two years, tax revenue growth isn’t even expected to cover inflation, even with an uptick in the economy.